Bioenergy and Biofuels
Biofuels are fuels produced from biomass and organic matter, which can be made from crops such as cereals or sugarcane, wood, grasses, or biological waste such as animal fats and oils.
These biomass sources can be converted into energy supplies in various ways. They can, for example, be burned to produce electricity in a power plant. They can also be processed into liquid fuels and used in cars, trucks, and planes. It’s these two “modern” applications that the data and research on this page focus on.
This page focuses on what is called modern bioenergy. Traditional bioenergy, which is the direct burning of wood, crops, and other biological waste, remains a primary source of energy for cooking and heating for billions of people. That is covered separately in our work on Energy Access.
Electricity from bioenergy
Electricity can be generated from biomass using various methods. The most common method is combustion: biomass, such as wood pellets, wood chips, and forest residues, is burned in a power plant, just like you’d do with coal. This creates steam, which turns a turbine, and this generates power.
Bioenergy accounts for a relatively small share of the world’s electricity, but, as we’ll see, in some countries, it’s a substantial source of power.
How much of the world’s electricity comes from bioenergy?
The chart below shows bioenergy’s share of the global electricity mix.
In 2000, it produced around 1% of the world’s electricity. This doubled over the next two decades, but has stagnated at just over 2% in the last five years.
In comparison to other sources of electricity, the growth of bioenergy has been relatively slow. It took almost 20 years for its share to increase one percentage point, from 1% to 2%. Solar power is now growing its share by more than one percentage point every year.

Which countries rely on bioenergy for electricity?
Some countries get a substantial share of their electricity from bioenergy. The map below shows the distribution across the world.
Luxembourg generates almost one-third from biomass. In Uruguay, Estonia, and Denmark, around one-fifth.
Bioenergy is much more common in Europe and South America than in other regions, for several reasons.
Many countries in Europe had existing or older coal plant infrastructure; these could be easily retrofitted to use biomass instead of coal. Several, including Finland, Sweden, Estonia, and Latvia, also have large forestry sectors that produce wood residues and lower-grade wood, which could be diverted towards electricity production. Bioenergy has made up a substantial share of their electricity generation for decades, so this is not a recent change. Policies in the European Union — where biomass is counted as a renewable source — have often encouraged a switch to bioenergy through subsidies and feed-in tariffs.
South America — as we’ll soon see — produces a lot of liquid biofuels for transport. In an effort to reduce their dependence on oil, several countries in South America have implemented large-scale programs to promote the production of bioethanol. The most notable is the “Proálcool” program in Brazil. Sugarcane is their primary biofuel crop, and it leaves behind a fibrous residue that can be used for electricity production.

Liquid biofuels for transport
Biofuels are also produced in liquid form and used as fuel in transport. As we’ll see, most of this biofuel comes from growing crops, such as corn, sugarcane, oil palm, and soybeans. Waste cooking oil and animal fats are also used to produce liquid fuels.
Today, most liquid biofuels are used in road transport. They can be blended with petrol or diesel at various concentrations, displacing some oil from the energy mix. But increasingly, they are promoted as a potential solution to decarbonizing sectors such as aviation or shipping.
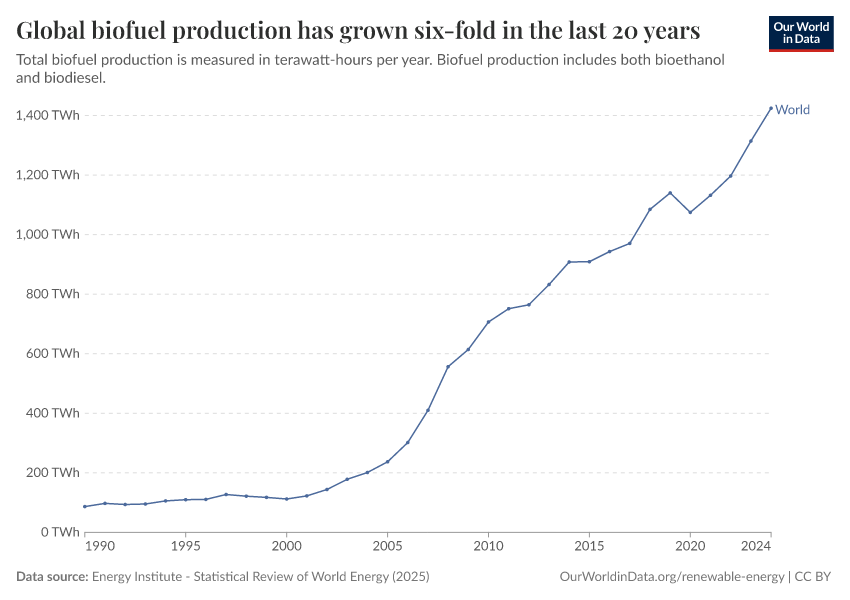
How has global liquid biofuel production changed over time?
Liquid biofuels have grown dramatically over the past few decades. As you can see in the chart below, global production has grown sevenfold in the last 20 years.
This has been driven by policies in a few key regions — particularly the United States, Brazil, and the European Union — that have actively promoted biofuel production.
Which countries produce biofuels?
Where in the world are these biofuels produced? You can see production — measured in terms of energy content — by country in the map below. Both the United States and Brazil stand out as the world’s largest producers.

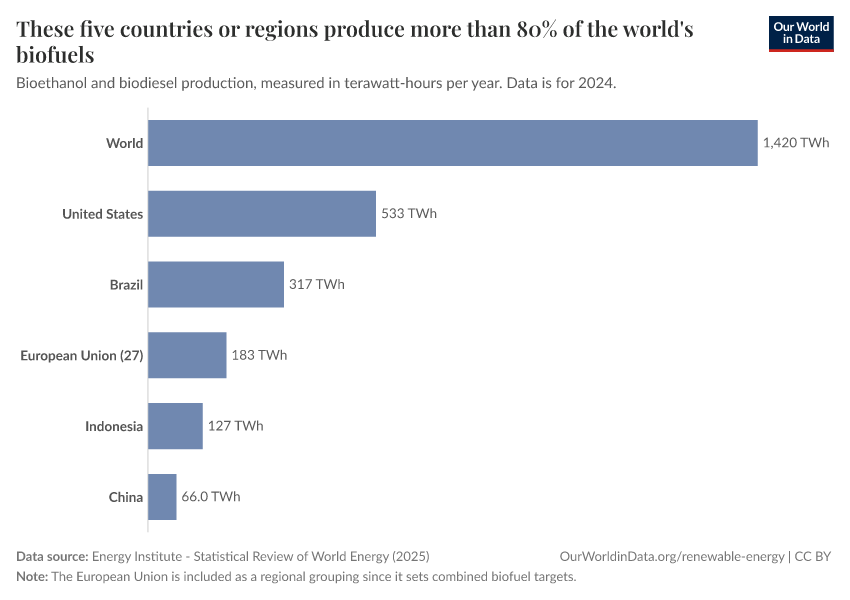
Only a handful of countries (or regions, if we consider the European Union collectively) produce most of the world’s biofuels.
The United States is the world’s largest producer, as you can see in the chart below. Next are Brazil, the EU, Indonesia, and China. These five countries/regions alone produce more than 80% of the global total.
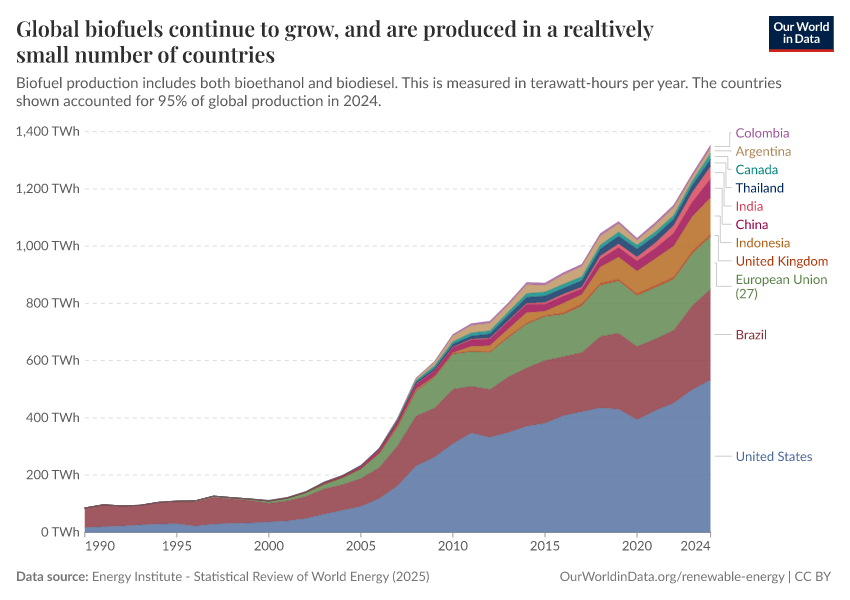
You can see how global production of liquid biofuels has changed over the last few decades, broken down by country. All of the major producers saw substantial growth over that time (and continue to do so).
Interest and policies oriented towards biofuels started in the United States in the 1990s as a way to reduce its dependence on foreign oil markets. In 2005, it introduced its Renewable Fuel Standard, which mandated that a minimum volume of the country’s transport fuel be sourced from biofuels. In 2007, it extended it further. This led to a rapid growth in biofuel production, mostly from corn (maize).
Brazil started using bioethanol decades earlier. As you can see, by the early 1990s, they were already producing significant volumes. However, production ramped up in the early 2000s, again, as a means to reduce the country’s dependence on oil for transportation. Most of its biofuels come from sugarcane.
What crops are used for biofuels?
What are the biomass sources of these fuels?
In the chart below, you can see a breakdown from the International Energy Agency. This shows each feedstock’s share of global liquid biofuels by volume (i.e., liters).
Most of the world’s biofuels — over 90% of them — come from food crops, not waste oils or fats. The largest source is corn (maize), which accounts for just over one-third of the total. Most of this comes from the United States, where biofuel demand has driven most of its growth in corn production over the last few decades.
Sugarcane — mostly produced in Brazil — is the second largest source, followed by oil crops including palm oil, soy oil, and rapeseed. Used cooking oil and animal fats make up around 12%.
How much land is used for biofuel production?
What makes this slightly complicated to answer is that biofuels often produce co-products that are allocated to other uses, such as animal feed. How you adjust this land used for biofuels and their co-products can lead to quite different results.
A recent analysis from researchers at Cerulogy estimated that biofuels are grown on 61 million hectares of land.1 But when they split this allocation between land for biofuels and land for animal feed, the land use for biofuels alone was 32 million hectares. The other 29 million hectares would be allocated for land use for animal feed.
There are much higher published figures. The Union for the Promotion of Oil and Protein Plants estimates that as much as 112 million hectares are “used to supply feedstock for biofuels”.2 By this definition, there is no adjustment for dual use of that land or the land use of co-products. That’s one of the reasons why the figures are much higher. Even taking this into account, the numbers are still higher, and it’s unclear why. The methodology is not fully transparent.
Putting the more recent figure of 32 million hectares into context: imagine an area like the one in the box below: 640 kilometers across, and 500 kilometers high. For context, that’s about the size of Germany, Poland, the Philippines, Finland, or Italy.
You can read more about the land use of biofuels, including some analysis on whether this land could be used for energy more efficiently, in our article:
What are biofuels used for?
Collectively, biofuels produce around 4% of the world’s energy demand for transport.
The vast majority of biofuel use is for road transport. The International Energy Agency reports around 99% of it.3
Less than 1% was used for aviation in 2023. But within aviation’s fuel supply, biofuel’s contribution is even smaller. We estimate that only around 0.4% of aviation’s energy demand comes from biofuels.4
You can see both of those points in the chart below.
You can read more about the contribution and potential of biofuels for aviation in our article:
Research & Writing
January 12, 2026
Putting solar panels on land used for biofuels would produce enough electricity for all cars and trucks to go electric
The world dedicates a Poland-sized area of land to liquid biofuels. Is there a more efficient way to generate energy?
January 26, 2026
Could biofuels meet demand for global aviation?
To fuel all of the world’s aviation demand, global biofuels would need to more than triple and be exclusively used for air travel.
Data Insights on Bioenergy and Biofuels
Endnotes
Sandford et al. (2024). Diverted harvest: Environmental Risk from Growth in International Biofuel Demand. Cerulogy.
They estimate that 8% of global croplands supply feedstock for biofuel production. Using their estimate of 1.4 billion hectares of total cropland, this would be 112 million hectares.
In 2024, the International Energy Agency estimates that 1.8 billion liters of liquid biofuel were for “biojet” fuel. Total production was 118 billion liters. That means biojet fuel was only 1%. We can probably assume that the rest was used for road transport, since its use in marine transport is also negligible.
The International Energy Agency (IEA) estimated that aviation energy demand in 2024 was 14.16 exajoules (EJ). That’s equivalent to 13.6 exajoules (EJ), or 3,932 terawatt-hours (TWh).
We estimate that biofuels used for aviation are equivalent to around 17 TWh. The IEA estimates that 1.8 billion liters of biojet fuel were used in 2024. With an energy content of 34 MJ per litre, this is equivalent to 61 billion MJ (or 0.061 EJ). That is equivalent to 17 TWh.
17 TWh is 0.43% of the 3,930 TWh demand [17/ 3,930 = 0.43%].
This is very similar to figures reported by the International Air Transport Association (IATA). It reported that in 2024, “In 2024, SAF production reached 1Mt (1.250 billion liters), doubling the amounts produced in 2023, representing 0.3% of global jet fuel use.”
By 2025, the IATA expected that this could be 0.6% of global demand.
Cite this work
Our articles and data visualizations rely on work from many different people and organizations. When citing this topic page, please also cite the underlying data sources. This topic page can be cited as:
Hannah Ritchie and Pablo Rosado (2026) - “Bioenergy and Biofuels” Published online at OurWorldinData.org. Retrieved from: 'https://ourworldindata.org/bioenergy-biofuels' [Online Resource]BibTeX citation
@article{owid-bioenergy-biofuels,
    author = {Hannah Ritchie and Pablo Rosado},
    title = {Bioenergy and Biofuels},
    journal = {Our World in Data},
    year = {2026},
    note = {https://ourworldindata.org/bioenergy-biofuels}
}
Reuse this work freely
All visualizations, data, and articles produced by Our World in Data are completely open access under the Creative Commons BY license. You have the permission to use, distribute, and reproduce these in any medium, provided the source and authors are credited.
The data produced by third parties and made available by Our World in Data is subject to the license terms from the original third-party authors. We will always indicate the original source of the data in our documentation, so you should always check the license of any such third-party data before use and redistribution.
All of our charts can be embedded in any site.