
What you should know about this indicator
- GDP per capita is a comprehensive measure of people's average income. It helps compare income levels across countries and track how they change over time. It is especially useful for understanding trends in economic growth and living standards.
- GDP per capita is calculated as the value of all final goods and services produced each year in a country (the gross domestic product), divided by the population. It represents the average economic output per person.
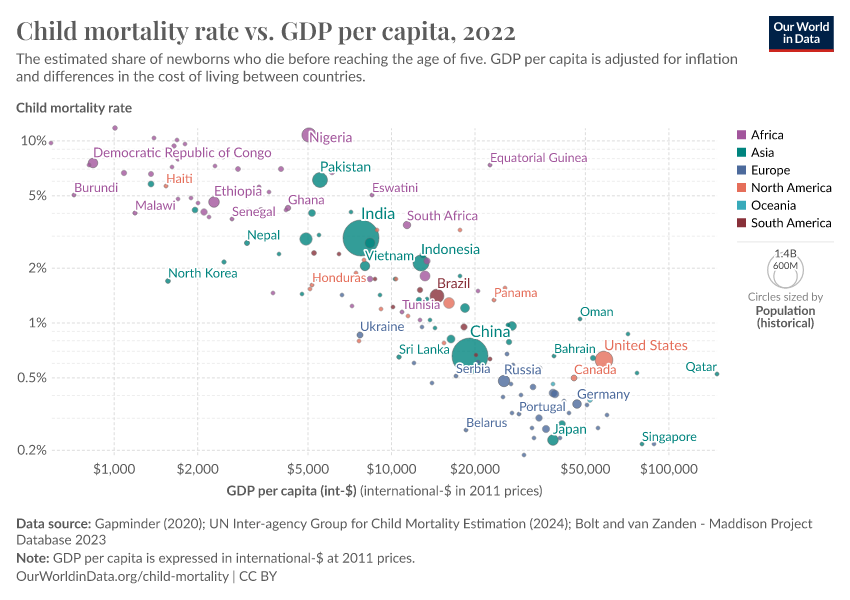
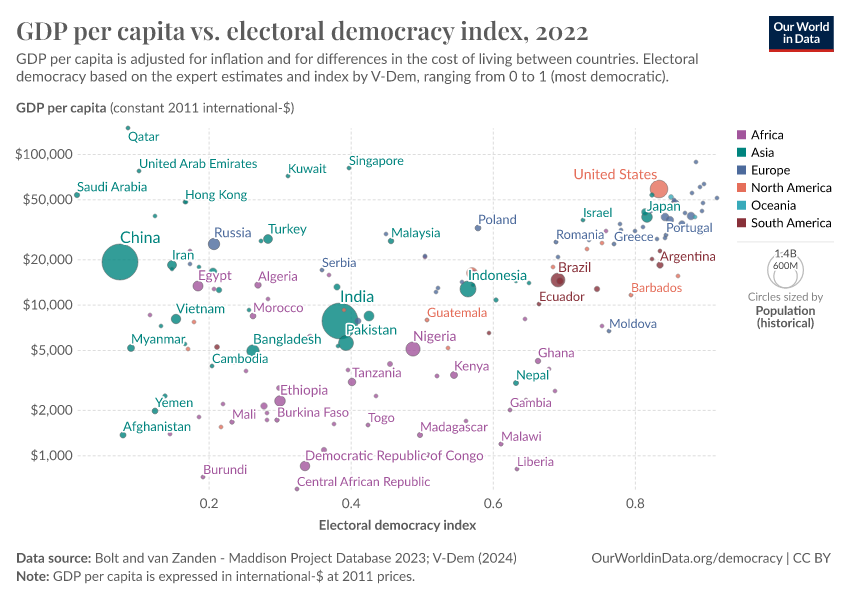
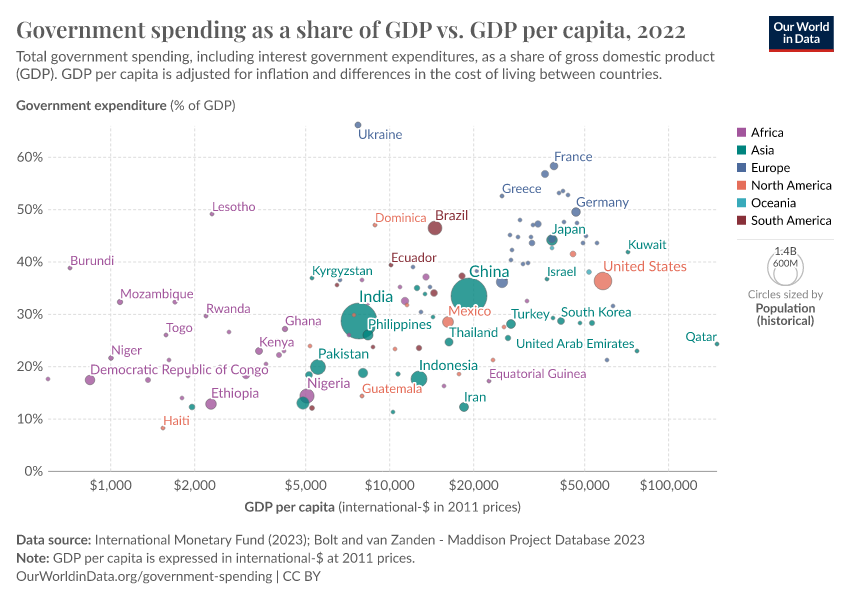
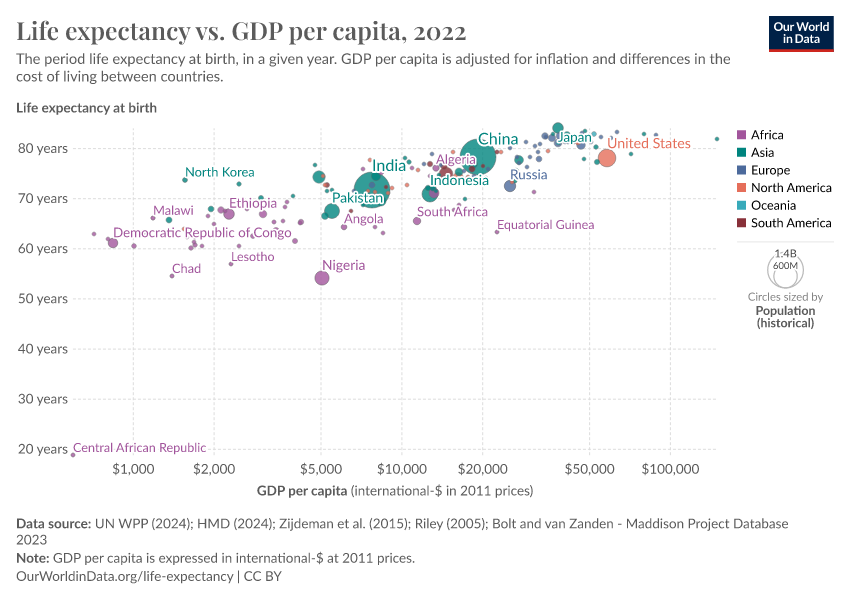
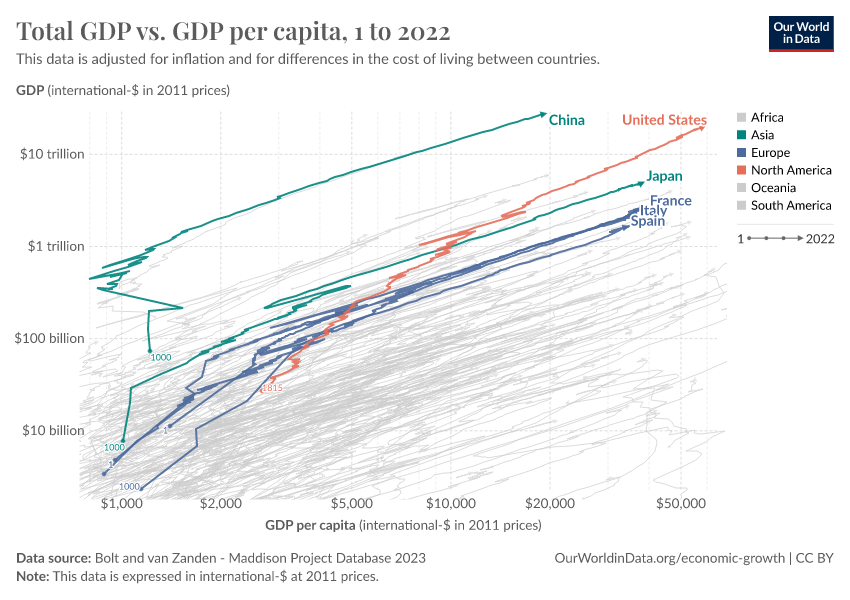
- This indicator shows the large inequality between people in different countries. In the poorest countries, average incomes are below $1,000 per year; in rich countries, they are more than 50 times higher.
- This data comes from the Maddison Project Database, which provides GDP per capita estimates for the very long run. Some country series extend as far back as 1 CE, and regional estimates start in 1820.
- This work builds on the efforts of many researchers who have carefully reconstructed historical data on economic growth and population for individual countries. You can find the full list of sources in the original dataset.
- This data is expressed in constant international dollars at 2011 prices to adjust for inflation and differences in living costs between countries. Read more in our article, What are international dollars?
- This dataset combines multiple purchasing power parity (PPP) benchmarks to ensure historical consistency and comparability over time. 1990 PPPs are used up to 1990, and 2011 PPPs are used from 2011 onward. For the years in between, they adjust the series to smoothly connect the two benchmarks. This approach preserves consistency with the original long-run estimates calculated by Angus Maddison.
- Time series for former countries and territories are calculated forward by estimating values based on their last official borders.
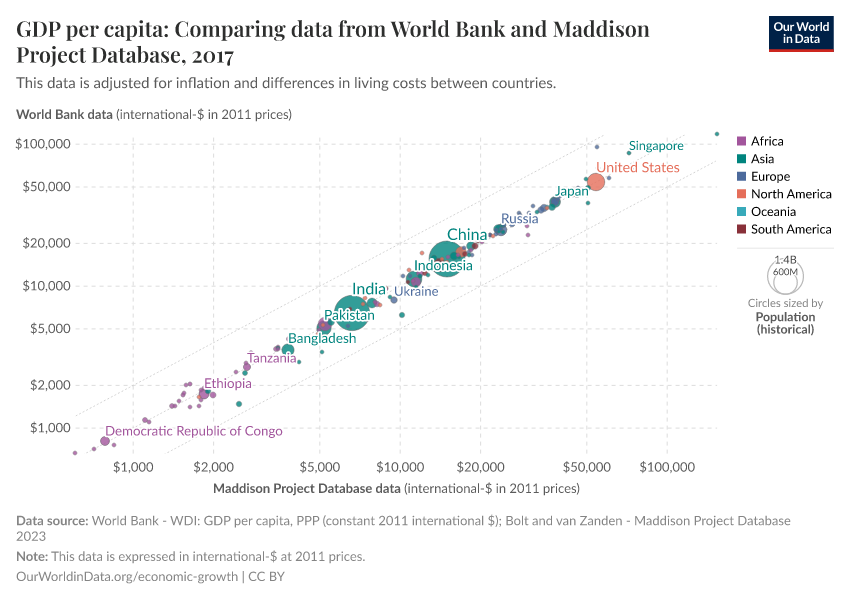
- For more frequently updated estimates since 1990, explore our chart of GDP per capita from the World Bank.
Related research and writing
What is economic growth? And why is it so important?
Breaking out of the Malthusian trap: How pandemics allow us to understand why our ancestors were stuck in poverty
Which countries achieved economic growth? And why does it matter?
Global poverty in an unequal world: Who is considered poor in a rich country? And what does this mean for our understanding of global poverty?
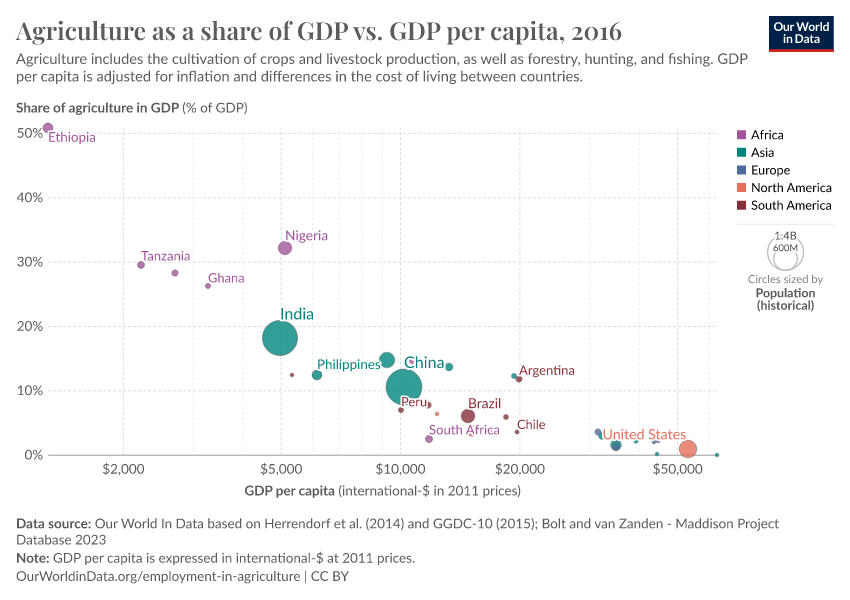
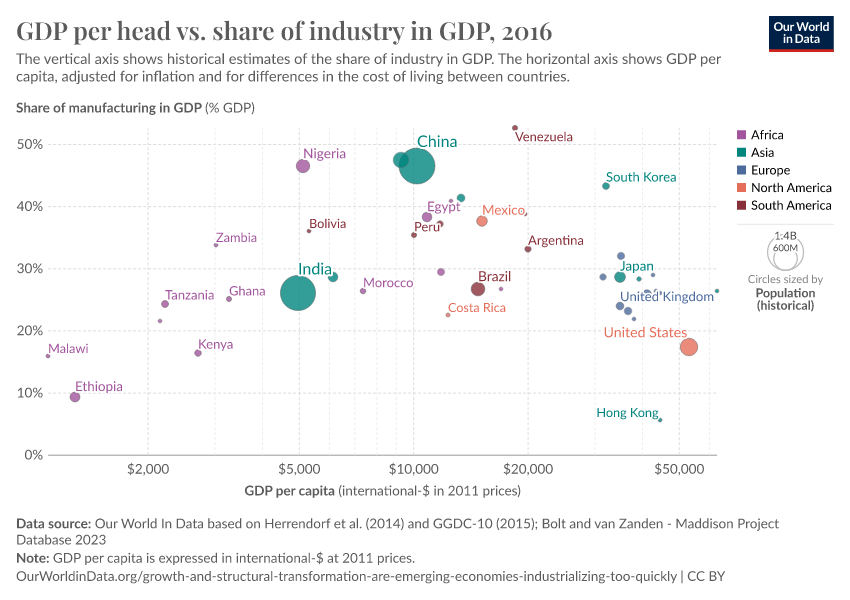
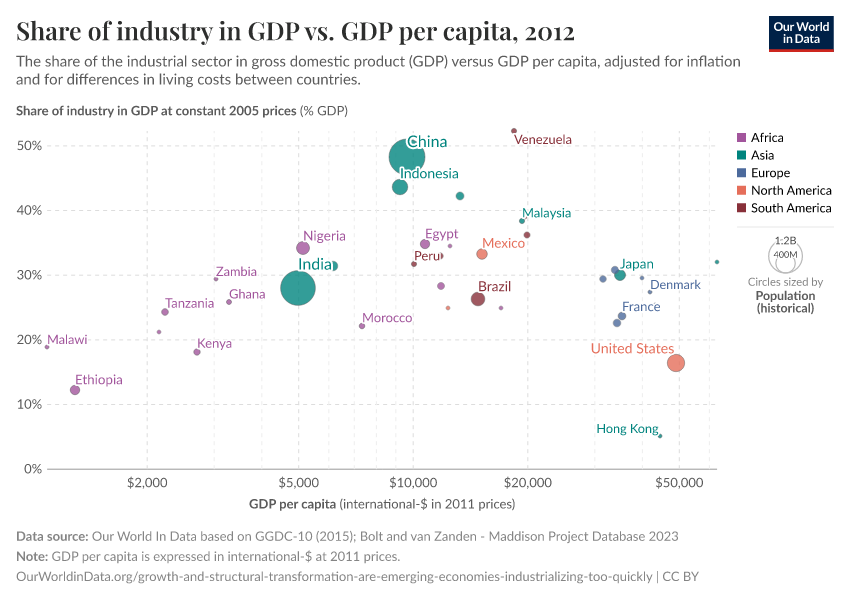
Are emerging economies deindustrializing too quickly?
Explore charts that include this data


More Data on Economic Growth
Frequently Asked Questions
What are international-$ and why are they used to measure incomes?
Much of the economic data we use to understand the world, such as the incomes people receive or the goods and services firms produce and people buy, is recorded in the local currencies of each country. That means the numbers start out in rupees, US dollars, yuan, and many others, and without adjusting for inflation over time. This is known as being in “current prices” or “nominal” terms.
Sources and processing
This data is based on the following sources
How we process data at Our World in Data
All data and visualizations on Our World in Data rely on data sourced from one or several original data providers. Preparing this original data involves several processing steps. Depending on the data, this can include standardizing country names and world region definitions, converting units, calculating derived indicators such as per capita measures, as well as adding or adapting metadata such as the name or the description given to an indicator.
At the link below you can find a detailed description of the structure of our data pipeline, including links to all the code used to prepare data across Our World in Data.
Reuse this work
Citations
How to cite this page
To cite this page overall, including any descriptions, FAQs or explanations of the data authored by Our World in Data, please use the following citation:
“Data Page: GDP per capita”, part of the following publication: Max Roser, Bertha Rohenkohl, Pablo Arriagada, Joe Hasell, Hannah Ritchie, and Esteban Ortiz-Ospina (2023) - “Economic Growth”. Data adapted from Bolt and van Zanden. Retrieved from https://archive.ourworldindata.org/20260518-110921/grapher/gdp-per-capita-maddison-project-database.html [online resource] (archived on May 18, 2026).How to cite this data
In-line citationIf you have limited space (e.g. in data visualizations), you can use this abbreviated in-line citation:
Bolt and van Zanden – Maddison Project Database 2023 – with minor processing by Our World in DataFull citation
Bolt and van Zanden – Maddison Project Database 2023 – with minor processing by Our World in Data. “GDP per capita – Maddison Project Database – Long-run data in constant international-$” [dataset]. Bolt and van Zanden, “Maddison Project Database 2023” [original data]. Retrieved June 13, 2026 from https://archive.ourworldindata.org/20260518-110921/grapher/gdp-per-capita-maddison-project-database.html (archived on May 18, 2026).Download
Quick download
Download the data shown in this chart as a ZIP file containing a CSV file, metadata in JSON format, and a README. The CSV file can be opened in Excel, Google Sheets, and other data analysis tools.
Data API
Use these URLs to programmatically access this chart's data and configure your requests with the options below. Our documentation provides more information on how to use the API, and you can find a few code examples below.
Data URL (CSV format)
https://pages.owid.io/grapher/gdp-per-capita-maddison-project-database.csv?v=1&csvType=full&useColumnShortNames=falseMetadata URL (JSON format)
https://pages.owid.io/grapher/gdp-per-capita-maddison-project-database.metadata.json?v=1&csvType=full&useColumnShortNames=falseExcel / Google Sheets
=IMPORTDATA("https://pages.owid.io/grapher/gdp-per-capita-maddison-project-database.csv?v=1&csvType=full&useColumnShortNames=false")Python with Pandas
import pandas as pd
import requests

# Fetch the data.
df = pd.read_csv("https://pages.owid.io/grapher/gdp-per-capita-maddison-project-database.csv?v=1&csvType=full&useColumnShortNames=false", storage_options = {'User-Agent': 'Our World In Data data fetch/1.0'})

# Fetch the metadata
metadata = requests.get("https://pages.owid.io/grapher/gdp-per-capita-maddison-project-database.metadata.json?v=1&csvType=full&useColumnShortNames=false").json()
R
library(jsonlite)

# Fetch the data
df <- read.csv("https://pages.owid.io/grapher/gdp-per-capita-maddison-project-database.csv?v=1&csvType=full&useColumnShortNames=false")

# Fetch the metadata
metadata <- fromJSON("https://pages.owid.io/grapher/gdp-per-capita-maddison-project-database.metadata.json?v=1&csvType=full&useColumnShortNames=false")
Stata
import delimited "https://pages.owid.io/grapher/gdp-per-capita-maddison-project-database.csv?v=1&csvType=full&useColumnShortNames=false", encoding("utf-8") clear