Data

Global meat demand if everyone ate like the average citizen of...
FAO
See all data and research on:

What you should know about this indicator

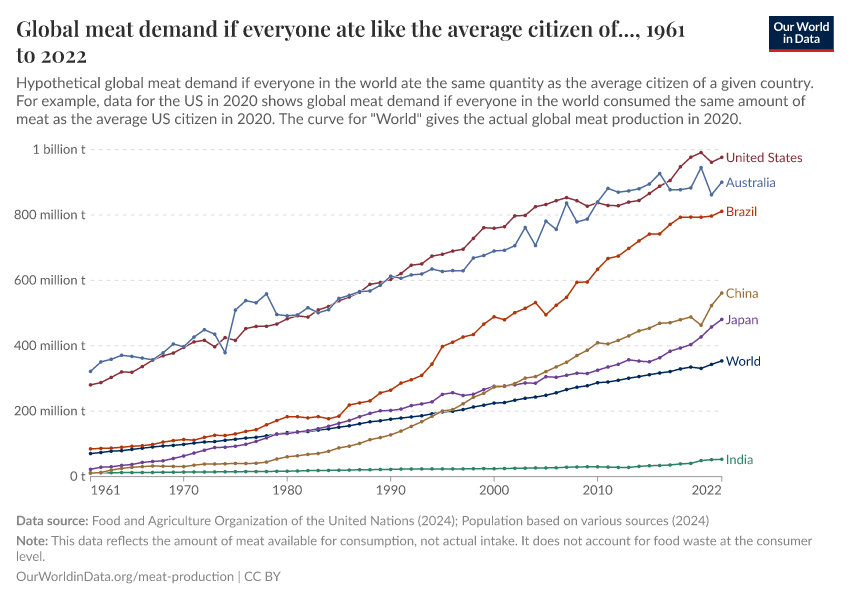
This is a hypothetical variable derived by Our World in Data which answers the question: "What would global meat production have to be if everyone in the world consumed the average per capita amount of a given country?". For example: "How much meat would we need to produce if everyone in the world consumed the same amount of meat as the average UK citizen?".

Global meat demand if everyone ate like the average citizen of...
FAO
Hypothetical global meat demand if everyone in the world ate the same quantity as the average citizen of a given country.
Source
Food and Agriculture Organization of the United Nations (2023); Gapminder - Population v7 (2022); Gapminder - Systema Globalis (2022); HYDE (2017); United Nations - World Population Prospects (2022) – with major processing by Our World in Data
Last updated
March 14, 2024
Next expected update
March 2025
Date range
1961–2022
Unit
tonnes

Sources and processing

This data is based on the following sources

Crop and livestock statistics are recorded for 278 products, covering the following categories:

  1. Crops primary: Cereals, Citrus Fruit, Fibre Crops, Fruit, Oil Crops, Oil Crops and Cakes in Oil Equivalent, Pulses, Roots and Tubers, Sugar Crops, Treenuts and Vegetables. Data are expressed in terms of area harvested, production quantity and yield. Area and production data on cereals relate to crops harvested for dry grain only. Cereal crops harvested for hay or harvested green for food, feed or silage or used for grazing are therefore excluded.

  2. Crops processed: Beer of barley; Cotton lint; Cottonseed; Margarine, short; Molasses; Oil, coconut (copra); Oil, cottonseed; Oil, groundnut; Oil, linseed; Oil, maize; Oil, olive, virgin; Oil, palm; Oil, palm kernel; Oil, rapeseed; Oil, safflower; Oil, sesame; Oil, soybean; Oil, sunflower; Palm kernels; Sugar Raw Centrifugal; Wine.

  3. Live animals: Animals live n.e.s.; Asses; Beehives; Buffaloes; Camelids, other; Camels; Cattle; Chickens; Ducks; Geese and guinea fowls; Goats; Horses; Mules; Pigeons, other birds; Pigs; Rabbits and hares; Rodents, other; Sheep; Turkeys.

  4. Livestock primary: Beeswax; Eggs (various types); Hides buffalo, fresh; Hides, cattle, fresh; Honey, natural; Meat (ass, bird nes, buffalo, camel, cattle, chicken, duck, game, goat, goose and guinea fowl, horse, mule, Meat nes, meat other camelids, Meat other rodents, pig, rabbit, sheep, turkey); Milk (buffalo, camel, cow, goat, sheep); Offals, nes; Silk-worm cocoons, reelable; Skins (goat, sheep); Snails, not sea; Wool, greasy.

  5. Livestock processed: Butter (of milk from sheep, goat, buffalo, cow); Cheese (of milk from goat, buffalo, sheep, cow milk); Cheese of skimmed cow milk; Cream fresh; Ghee (cow and buffalo milk); Lard; Milk (dry buttermilk, skimmed condensed, skimmed cow, skimmed dried, skimmed evaporated, whole condensed, whole dried, whole evaporated); Silk raw; Tallow; Whey (condensed and dry); Yoghurt.

Retrieved on
March 14, 2024
Citation
This is the citation of the original data obtained from the source, prior to any processing or adaptation by Our World in Data. To cite data downloaded from this page, please use the suggested citation given in Reuse This Work below.
Food and Agriculture Organization of the United Nations - Production: Crops and livestock products (2023).
Retrieved on
March 31, 2023
Retrieved from
Citation
This is the citation of the original data obtained from the source, prior to any processing or adaptation by Our World in Data. To cite data downloaded from this page, please use the suggested citation given in Reuse This Work below.
Gapminder Population v7 (2022).
Gapminder's population data is divided into two chunks: One long historical trend for the global population that goes back to 10,000 BC. And the second chunk is country estimates that only reaches back to 1800. For the first chunk, several sources were used. You can learn more at https://docs.google.com/spreadsheets/d/1hkLbEilJbl630IG68q-aQJlUjuTFm9b_12nQMVd1sZM/edit#gid=0. For the second chunk, Gapminder uses UN population data between 1950 to 2100 from the UN Population Division World Population Prospects 2019, and the forecast to the year 2100 uses their medium-fertility variant. For years before 1950, this version uses the data documented in greater detail by Mattias Lindgren in version 3. The main source was Angus Maddison's data, which CLIO Infra Project maintained and improved. Note that when combining version 3 with the new UN data, the trends for a few countries didn't match up in the overlapping year 1950. Minor adjustments were made to the years before and after to smooth out discrepancies between the two sources and avoid spurious jumps in Gapminder's visualisations. Visit https://www.gapminder.org/data/documentation/gd003/ to learn more about the methodology used and the data from back to 10,000 BC.
Retrieved on
March 31, 2023
Citation
This is the citation of the original data obtained from the source, prior to any processing or adaptation by Our World in Data. To cite data downloaded from this page, please use the suggested citation given in Reuse This Work below.
Gapminder - Systema Globalis (2023).

HYDE is an internally consistent combination of updated historical population (gridded) estimates and land use for the past 12,000 years. Categories include cropland, with a new distinction into irrigated and rain fed crops (other than rice) and irrigated and rain fed rice. Also grazing lands are provided, divided into more intensively used pasture, converted rangeland and non-converted natural (less intensively used) rangeland. Population is represented by maps of total, urban, rural population and population density as well as built-up area.

Retrieved on
October 1, 2021
Citation
This is the citation of the original data obtained from the source, prior to any processing or adaptation by Our World in Data. To cite data downloaded from this page, please use the suggested citation given in Reuse This Work below.
Klein Goldewijk, K., A. Beusen, J.Doelman and E. Stehfest (2017), Anthropogenic land use estimates for the Holocene; HYDE 3.2, Earth System Science Data, 9, 927-953.

World Population Prospects 2022 is the 27th edition of the official estimates and projections of the global population that have been published by the United Nations since 1951. The estimates are based on all available sources of data on population size and levels of fertility, mortality and international migration for 237 countries or areas. More details at https://population.un.org/wpp/Publications/.

Retrieved on
September 9, 2022
Citation
This is the citation of the original data obtained from the source, prior to any processing or adaptation by Our World in Data. To cite data downloaded from this page, please use the suggested citation given in Reuse This Work below.
United Nations, Department of Economic and Social Affairs, Population Division (2022). World Population Prospects 2022, Online Edition.

How we process data at Our World in Data

All data and visualizations on Our World in Data rely on data sourced from one or several original data providers. Preparing this original data involves several processing steps. Depending on the data, this can include standardizing country names and world region definitions, converting units, calculating derived indicators such as per capita measures, as well as adding or adapting metadata such as the name or the description given to an indicator.

At the link below you can find a detailed description of the structure of our data pipeline, including links to all the code used to prepare data across Our World in Data.

Read about our data pipeline
Notes on our processing step for this indicator
  • This indicator was calculated by multiplying global population by per capita meat supply of a given country.

Reuse this work

  • All data produced by third-party providers and made available by Our World in Data are subject to the license terms from the original providers. Our work would not be possible without the data providers we rely on, so we ask you to always cite them appropriately (see below). This is crucial to allow data providers to continue doing their work, enhancing, maintaining and updating valuable data.
  • All data, visualizations, and code produced by Our World in Data are completely open access under the Creative Commons BY license. You have the permission to use, distribute, and reproduce these in any medium, provided the source and authors are credited.

Citations

How to cite this page

To cite this page overall, including any descriptions, FAQs or explanations of the data authored by Our World in Data, please use the following citation:

“Data Page: Global meat demand if everyone ate like the average citizen of...”, part of the following publication: Hannah Ritchie, Pablo Rosado and Max Roser (2023) - “Agricultural Production”. Data adapted from Food and Agriculture Organization of the United Nations, Gapminder, PBL Netherlands Environmental Assessment Agency, United Nations. Retrieved from https://ourworldindata.org/grapher/hypothetical-global-meat-demand [online resource]
How to cite this data

In-line citationIf you have limited space (e.g. in data visualizations), you can use this abbreviated in-line citation:

Food and Agriculture Organization of the United Nations (2023) and other sources – with major processing by Our World in Data

Full citation

Food and Agriculture Organization of the United Nations (2023); Gapminder - Population v7 (2022); Gapminder - Systema Globalis (2022); HYDE (2017); United Nations - World Population Prospects (2022) – with major processing by Our World in Data. “Global meat demand if everyone ate like the average citizen of... – FAO” [dataset]. Food and Agriculture Organization of the United Nations, “Production: Crops and livestock products”; Gapminder, “Population v7”; Gapminder, “Systema Globalis”; PBL Netherlands Environmental Assessment Agency, “HYDE 3.2”; United Nations, “World Population Prospects” [original data]. Retrieved January 10, 2025 from https://ourworldindata.org/grapher/hypothetical-global-meat-demand