Interactive visualization requires JavaScript
Related research and data
Charts
- Average nitrate concentration in freshwater
- Average phosphorus concentration in freshwater
- Cereal yield vs. fertilizer use
- Eutrophying emissions per 100 grams of protein
- Eutrophying emissions per 1000 kilocalories
- Eutrophying emissions per kilogram of food product
- Excess nitrogen from croplands
- Excess nitrogen per hectare of cropland
- Excess phosphorus from croplands
- Excess phosphorus per hectare of cropland
- Fertilizer application rates over the long-run
- Fertilizer consumption
- Fertilizer production by nutrient type
- Fertilizer use by nutrient
- Fertilizer use per capita
- Fertilizer use per hectare of arable land
- Fertilizer use per hectare of cropland
- Fertilizer use per hectare of croplandStacked bar chart
- Fertilizer use vs. GDP per capita
- Global fertilizer exports: how much comes from Russia, Belarus & Ukraine?
- Nitrogen and phosphorus concentration in coastal areas
- Nitrogen fertilizer use per hectare of cropland
- Nitrogen inputs per hectare of cropland
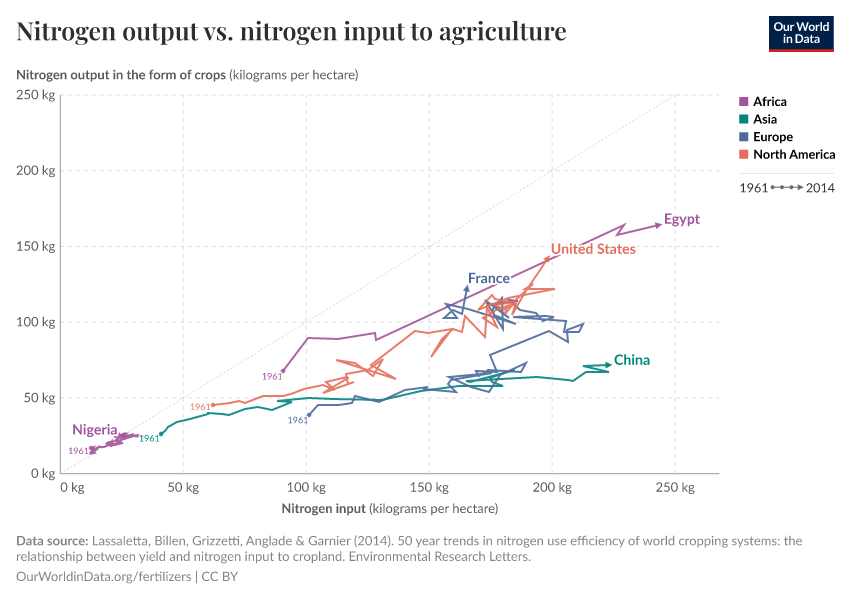
- Nitrogen use efficiency
- Phosphate fertilizer use per hectare of cropland
- Phosphorous inputs per hectare of cropland
- Potash fertilizer use per hectare of cropland
- Share of global excess nitrogen from croplands
- Share of global excess phosphorus from croplands
- Total applied phosphorous to crops
- Total nitrogen inputs to crops
- Which countries overapplied nitrogen without gains in crop yields?
- World population supported by synthetic nitrogen fertilizers
- World population with and without synthetic nitrogen fertilizers