Data

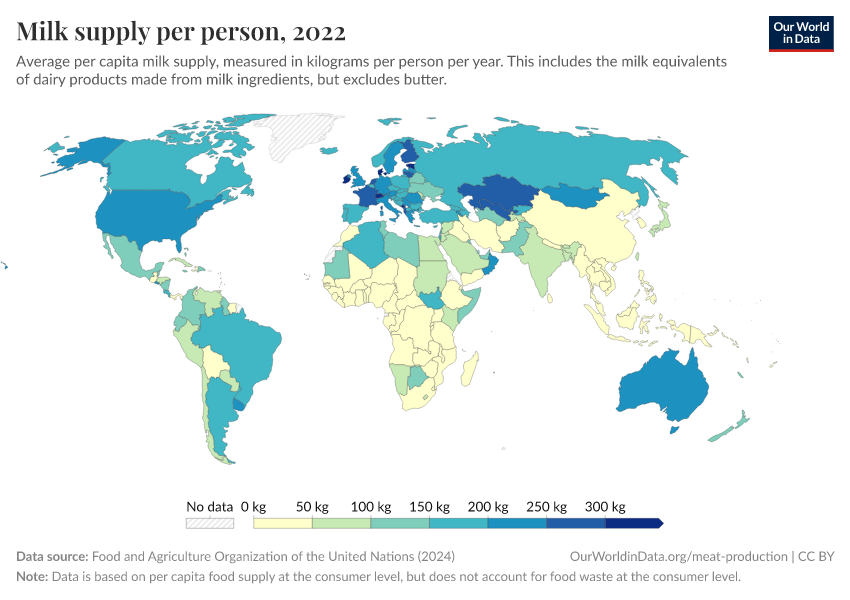
Per capita consumption of milk, excluding butter

FAO
See all data and research on:

What you should know about this indicator

Item: Milk - Excluding Butter Description: Default composition: 882 Milk, whole fresh cow, 888 Milk, skimmed cow, 889 Milk, whole condensed, 890 Whey, condensed, 891 Yoghurt, 892 Yoghurt, concentrated or not, 893 Buttermilk, curdled, acidified milk, 894 Milk, whole evaporated, 895 Milk, skimmed evaporated, 896 Milk, skimmed condensed, 897 Milk, whole dried, 898 Milk, skimmed dried, 899 Milk, dry buttermilk, 900 Whey, dry, 901 Cheese, whole cow milk, 903 Whey, fresh, 904 Cheese, skimmed cow milk, 905 Whey, cheese, 907 Cheese, processed, 908 Milk, reconstituted, 909 Milk, products of natural constituents nes, 910 Ice cream and edible ice, 917 Casein, 951 Milk, whole fresh buffalo, 954 Milk, skimmed buffalo, 955 Cheese, buffalo milk, 982 Milk, whole fresh sheep, 984 Cheese, sheep milk, 985 Milk, skimmed sheep, 1020 Milk, whole fresh goat, 1021 Cheese of goat mlk, 1023 Milk, skimmed goat, 1130 Milk, whole fresh camel

Metric: Food available for consumption Description: Originally given per-capita, and converted into total figures by multiplying by population (given by FAO). Per-capita values are obtained by dividing the original values by the population (either provided by FAO or by OWID).

Source
Food and Agriculture Organization of the United Nations (2023) – with major processing by Our World in Data
Last updated
March 14, 2024
Next expected update
March 2025
Date range
1961–2021
Unit
kilograms per year per capita

Sources and processing

This data is based on the following sources

Food Balance Sheet presents a comprehensive picture of the pattern of a country's food supply during a specified reference period.

The food balance sheet shows for each food item - i.e. each primary commodity and a number of processed commodities potentially available for human consumption - the sources of supply and its utilization. The total quantity of foodstuffs produced in a country added to the total quantity imported and adjusted to any change in stocks that may have occurred since the beginning of the reference period gives the supply available during that period.

On the utilization side a distinction is made between the quantities exported, fed to livestock, used for seed, put to manufacture for food use and non-food uses, losses during storage and transportation, and food supplies available for human consumption. The per caput supply of each such food item available for human consumption is then obtained by dividing the respective quantity by the related data on the population actually partaking of it. Data on per caput food supplies are expressed in terms of quantity and - by applying appropriate food composition factors for all primary and processed products - also in terms of caloric value and protein and fat content.

Retrieved on
March 14, 2024
Citation
This is the citation of the original data obtained from the source, prior to any processing or adaptation by Our World in Data. To cite data downloaded from this page, please use the suggested citation given in Reuse This Work below.
Food and Agriculture Organization of the United Nations - Food Balances: Food Balances (-2013, old methodology and population) (2023).

Food Balance Sheet presents a comprehensive picture of the pattern of a country's food supply during a specified reference period.

The food balance sheet shows for each food item - i.e. each primary commodity and a number of processed commodities potentially available for human consumption - the sources of supply and its utilization. The total quantity of foodstuffs produced in a country added to the total quantity imported and adjusted to any change in stocks that may have occurred since the beginning of the reference period gives the supply available during that period.

On the utilization side a distinction is made between the quantities exported, fed to livestock, used for seed, put to manufacture for food use and non-food uses, losses during storage and transportation, and food supplies available for human consumption. The per caput supply of each such food item available for human consumption is then obtained by dividing the respective quantity by the related data on the population actually partaking of it. Data on per caput food supplies are expressed in terms of quantity and - by applying appropriate food composition factors for all primary and processed products - also in terms of caloric value and protein and fat content.

Retrieved on
March 14, 2024
Citation
This is the citation of the original data obtained from the source, prior to any processing or adaptation by Our World in Data. To cite data downloaded from this page, please use the suggested citation given in Reuse This Work below.
Food and Agriculture Organization of the United Nations - Food Balances: Food Balances (2010-) (2023).

How we process data at Our World in Data

All data and visualizations on Our World in Data rely on data sourced from one or several original data providers. Preparing this original data involves several processing steps. Depending on the data, this can include standardizing country names and world region definitions, converting units, calculating derived indicators such as per capita measures, as well as adding or adapting metadata such as the name or the description given to an indicator.

At the link below you can find a detailed description of the structure of our data pipeline, including links to all the code used to prepare data across Our World in Data.

Read about our data pipeline

Reuse this work

  • All data produced by third-party providers and made available by Our World in Data are subject to the license terms from the original providers. Our work would not be possible without the data providers we rely on, so we ask you to always cite them appropriately (see below). This is crucial to allow data providers to continue doing their work, enhancing, maintaining and updating valuable data.
  • All data, visualizations, and code produced by Our World in Data are completely open access under the Creative Commons BY license. You have the permission to use, distribute, and reproduce these in any medium, provided the source and authors are credited.

Citations

How to cite this page

To cite this page overall, including any descriptions, FAQs or explanations of the data authored by Our World in Data, please use the following citation:

“Data Page: Per capita consumption of milk, excluding butter”, part of the following publication: Hannah Ritchie, Pablo Rosado and Max Roser (2023) - “Agricultural Production”. Data adapted from Food and Agriculture Organization of the United Nations. Retrieved from https://ourworldindata.org/grapher/per-capita-milk-consumption [online resource]
How to cite this data

In-line citationIf you have limited space (e.g. in data visualizations), you can use this abbreviated in-line citation:

Food and Agriculture Organization of the United Nations (2023) – with major processing by Our World in Data

Full citation

Food and Agriculture Organization of the United Nations (2023) – with major processing by Our World in Data. “Per capita consumption of milk, excluding butter – FAO” [dataset]. Food and Agriculture Organization of the United Nations, “Food Balances: Food Balances (-2013, old methodology and population)”; Food and Agriculture Organization of the United Nations, “Food Balances: Food Balances (2010-)” [original data]. Retrieved January 9, 2025 from https://ourworldindata.org/grapher/per-capita-milk-consumption