Religion
Published in February 2026.
Most people in the world are religious. Religion — the beliefs, institutions, and practices that societies hold — play an important role in how billions of people live and think. For many, it plays a crucial role in their overall well-being and connection to others. It affects how cultures form and interact, how social attitudes evolve, and the policies that countries put in place or remove. Throughout the history of religion, it has played a crucial role in the global dynamics of conflict and cooperation, and it continues to do so today.
Religiosity, just like urbanization or migration, is an important demographic indicator that helps us to understand the world and how it’s changing.
There are also prominent debates about whether religion is in decline or whether, in particular demographics, there is a resurgence.1 These debates are often tied to political arguments and can therefore shape societal narratives and outcomes. Data can help us interrogate some of these patterns.
On this page, we explore patterns of religious affiliation, participation, and belief. We look at data on changes in religiosity — and the potential decline of religion — across countries and over time.
Religious affiliation: Which religions do people say they belong to?
One way to understand how religious a society is, and what religions people identify with, is to simply ask people directly.
Globally, most people say they belong to a religion, with Christianity and Islam accounting for the largest shares, but patterns vary widely across countries and regions.
That’s what the data on religious affiliation in this section captures. It relies on survey and census responses. Someone is described as being religious or non-religious based on their self-identification. If they report in a survey that they are Christian, Muslim, or Hindu, this is what is recorded, regardless of their actual practices or specific beliefs.
In this section, we look at this same affiliation data from several angles: how many people identify with a religion, which religions they identify with, and how these patterns vary across countries and regions.
Most of this data comes from the Pew Research Center. Its large global analyses are based on more than 2,700 sources of data, including national censuses, large-scale demographic surveys, general population surveys, and population registers.2
How many people say they are part of a religion?
In 2020, three-quarters of people globally said they were religious.3 That means they were self-affiliated with at least one of the world’s religions.
But there are huge variations in religiosity across the world. In the map below, you can see the share of people religiously affiliated by country.
Across Africa, the Middle East, and South America, the vast majority of people are religious. Rates tend to be well over 90%.
Across Asia, Europe, and North America, rates are more mixed. In some Asian countries, such as India, Pakistan, and Bangladesh, almost everyone says they follow a religion. But you can see that in China, rates are much lower. There, only around 10% do.
In Europe, you also see large differences. Eastern Europe tends to be more religious. But even within Western and Southern Europe, there’s a lot of variation. More than 80% of people in Portugal, Italy, Denmark, and Ireland identify with a religion, compared to less than half in the Netherlands.

In the bar chart below, you can compare the rates of specific countries. Again, the large differences are clear, even for countries in a similar region.

The largest religious groups in the world
Globally, Christians are the largest group based on self-identified religious identity. You can see this in the chart.

Around 2.3 billion people identified as Christian, which was only slightly higher than the number that identified as Muslim.
Those who are not affiliated with any religion were the third largest group, and were more than all other religions — except Christianity and Islam — combined. Two-thirds of the 1.9 billion who are religiously unaffiliated are from China.4
Beyond the global totals, religious affiliation is also unevenly distributed across the world's regions.
Most people who identify as Hindu or Buddhist live in Asia. People who report having no religious affiliation are also concentrated there, reflecting the fact that this group is the largest in countries such as China, Japan, and South Korea.
People who identify as Muslim are more widely distributed: while most live in Asia, large shares also live in Sub-Saharan Africa, North Africa, and the Middle East.
People who identify as Christian are the most geographically dispersed, with substantial shares living in Asia, Sub-Saharan Africa, Europe, and the Americas.
Finally, people who identify as Jewish make up a much smaller share of the global population and are concentrated mainly in North America and the Middle East.
Religious affiliation across countries
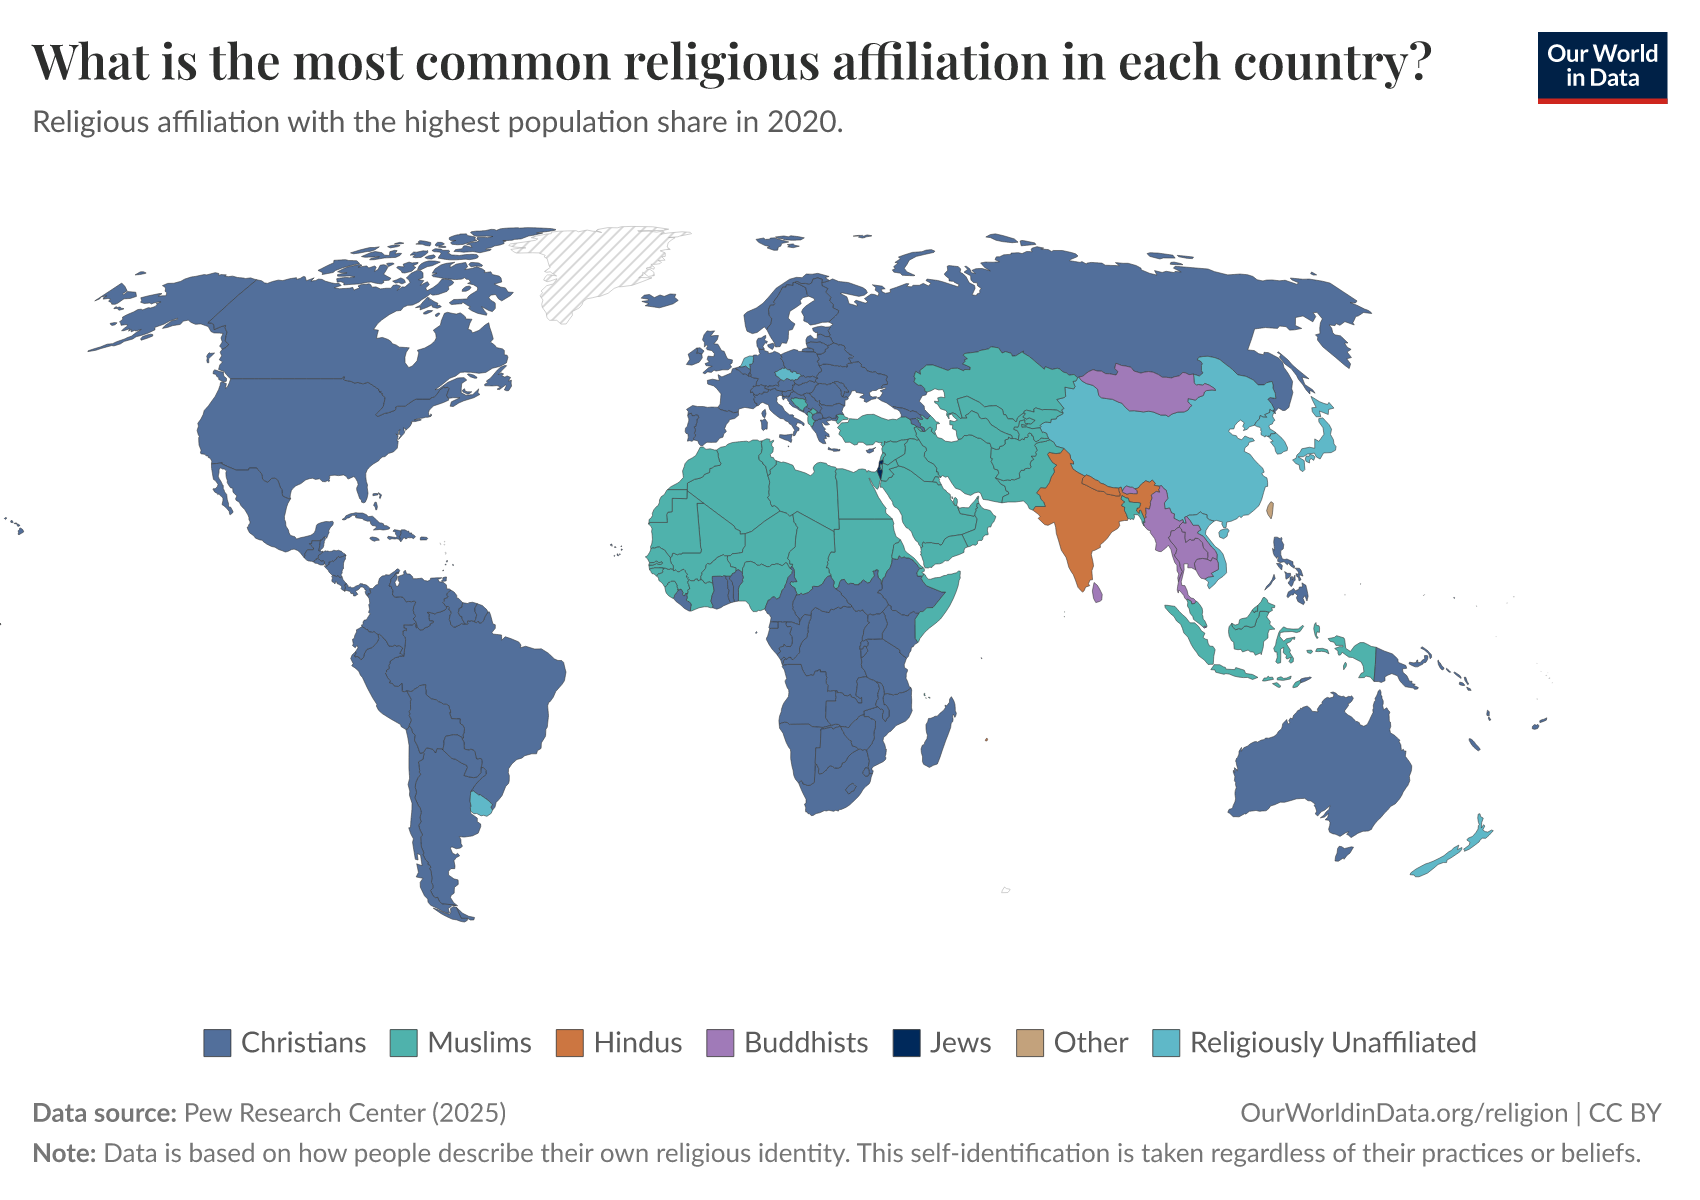
The most common religious affiliation in each country
Religious affiliation differs widely across countries, both in how diverse religious identities are and in which groups are most common.
Before digging into detailed breakdowns, we can look at the most common religion in each country. That is, the one that has the most self-identified followers. This is mapped below.
Across the Americas, Europe, and Southern Africa, Christianity is the dominant religion. The few exceptions are mostly countries where the largest group is those who don’t follow any religion at all.
Across Northern Africa and the Middle East, Islam is the most common. And across Asia, there is much more variation. In India, Hinduism is the most common. For its neighbors, it’s Islam or Buddhism. In East Asia — including China, Japan, and South Korea — the non-religious are the largest group.
The composition of religious affiliation in each country
What does the religious composition of countries look like beyond the most common affiliation?
You can see the full breakdown in the chart below.
In some countries, there is substantial diversity. In the UK, for example, no religious group accounts for more than half of the population: just under 50% are Christians; 40% follow no religion, and the remaining 10% is a mix of many others.
In a country like Egypt, there is much less diversity: 95% of the population identifies as Muslim, and the remaining 5% as Christian. In China, approximately 90% of the population has no religious affiliation.

Religious participation: How much does religion matter in people’s lives?
Most people in the world say they are religious, but the significance of religion varies a lot from person to person. Someone might believe in particular religious principles, but not actively participate in rituals or engage much with a religious community (and vice versa). For others, religion is a huge part of their lives and is a defining factor in key decisions.
So it’s useful to look not just at how many people say they are affiliated with a religion, but how important it is to them, and how often they participate in rituals and services.
How important is religion in people’s lives?
The following chart shows people’s survey responses to the question of how important religion is in their lives. This data comes from the Integrated Values Surveys.5
In Indonesia, Egypt, Nigeria, and Ethiopia, almost everyone says that religion is “very important”. At the other end of the spectrum — in countries like Japan and China, where most people are not religious — most say that it’s “not very” or “not at all” important.
The majority of Americans — around 60% of them — say it’s “very” or “rather” important. That’s the opposite of countries like the United Kingdom and Germany, where around two-thirds say that it’s not important.

We might expect religion to be seen as more important in countries where more people identify as religious. This is broadly true, but there is some variation: in some places, many people report a religious affiliation while relatively few say religion plays a very important role in their lives.
In the scatterplot, you can see these two metrics plotted against each other.6 There is a very clear and strong relationship, but with interesting regional patterns. Many European countries have high rates of affiliation, but very few people consider it to be very important to them. Take Denmark as an example. More than 80% of Danes say that they are religious, but only 5% say it’s “very important”.
In Europe, there are only a few countries where more than 50% of people say it’s very important. By contrast, there is no African country in this dataset where this figure is lower than 85%.

How often do people pray or attend religious services?
The frequency of religious rituals and practices also provides some indication of the role that religion plays in people’s lives.
The chart below shows the percentage of people who report praying at least several times per week, excluding events such as weddings and funerals.7
Across many countries in Europe, one-quarter to one-third of the population does so. Across much of Africa, the Middle East, and South-East Asia, the share can be three times higher.

The chart below shows the share who attend religious services at least once a month.
Across the world, people are more likely to pray than to attend religious services. 62% of Americans pray at least once a month, but only 39% attend a religious service. In Pakistan, 90% of the population prays, but only 61% attend services frequently.

Religious attitudes: What do people think and feel about religion?
Religiosity can also be measured based on people’s overall attitudes towards religion, both in terms of their feelings about their own religion’s institutions, but also how they feel about people who follow different religions.
These attitudes can matter a lot for social cohesion, trust, and even conflict within a given society or country. In this section, we look at survey data on these attitudes to understand levels of trust within religious communities and people’s comfort with religious diversity.
Trust in religious institutions
Many religions are organized around institutions — for example, churches, mosques, or temple communities — which function as organizational centers that host worship, provide religious guidance, and foster communal ties.
The chart below shows how much trust people place in these religious institutions. It is based on surveys asking whether respondents trust them “completely” or “somewhat”. In the survey wording, the institutions are labeled as “churches”, but it is intended to capture trust in religious institutions broadly, including mosques, temples, and similar organizations.
China and Japan stand out as having low levels of trust in these institutions, but both are countries where people who are non-religious are the largest group. So that’s not particularly surprising: trust correlates quite strongly with levels of religiosity.
Trust is extremely high across South Asia, the Middle East, and a small number of countries in Africa for which we have data from this survey. In these countries, trust in “the churches” tends to be far higher than trust in other organizations, such as the police, companies, educational institutions, and the media.

Tolerance and trust in people who follow other religions
As countries become more demographically diverse, building and maintaining trust among people from different religions can be important for a country’s stability and social cohesion.
The chart below shows the share of people who say that they “trust completely” or “trust somewhat” people of another religion.
Trust is particularly high in Nordic countries, the United Kingdom, Canada, and the United States. There, three-quarters of people or more say that they trust others.
At the other end of the scale, rates can be less than one-in-five in countries like Japan and China.
You can see here how trust in people of another religion compares to people’s trust in other groups. Trust in people of another religion tends to correlate strongly with overall trust in others within a society. That means this indicator may largely reflect aggregate trust levels within a country, rather than cross-religion trust specifically.

Another way to understand people’s tolerance or trust is to ask whether they would or would not want particular groups as neighbors. In the chart below, you can see the share of people who said they would not want neighbors who followed a different religion from them.
In many countries, the share was extremely small. In the United Kingdom, Germany, the United States, Australia, Brazil, and Kenya, fewer than 5% said they would be unhappy.
In others, the responses were very different. Across most of Asia, well over one-quarter, and sometimes more than half of people said they would not want neighbors who follow a different religion. These are often countries with a long history of conflict or discrimination between different religious groups.

Changes in religiosity over time: How are religious identities and practices shifting?
So far, we’ve mostly examined a snapshot of religious affiliation, beliefs, and practices across the world today. But how have these patterns changed over time, and how might we expect them to change in the future? Are societies becoming more or less religious?
In this section, we’ll look at changes in religious affiliation over the past decade and how we might expect religious identity to change in the future.
Recent changes in religious affiliation
Many countries lack high-quality long-term data on religious identity. For now, the only globally comparable time series comes from Pew’s estimates for 2010 and 2020, which we use here to examine recent changes.
Where did religious affiliation decline or increase over that decade?
The chart below shows the percentage point change in the share of people affiliated with any religion over the 10-year period. Note that this is different from the percentage change. If 70% of a country’s population identified as religious in 2010, and this dropped to 60% in 2020, then the value would be negative 10 percentage points.

The countries in red all saw a drop in religiosity. Australia experienced the largest decline, with a 17-point drop. Chile and Uruguay were not far behind. The United States also saw a substantial decline of 13 points.
Many countries — particularly those in Northern Africa, the Middle East, and South-East Asia — saw little change. Almost everyone identified as being religious in 2010, and this was still true in 2020. A small number of countries across Sub-Saharan Africa saw an increase of up to 5 percentage points.
Overall, countries across the Americas, Europe, East Asia, and Oceania have seen lower levels of religious affiliation over time. The rest of the world has not.
Religious identity and development
One relationship we see when we plot religiosity metrics against development or income indicators is that more people identify as non-religious in more developed countries.
The scatterplot below shows the share of people who are not religious in each country, measured against gross domestic product (GDP) per capita.
As you can see, rates of non-religiosity tend to be higher in countries with higher incomes.

Many studies have documented this relationship between income and the decline of religion.8 But the specific reasons or causal drivers of this are still debated.9 In a follow-up article, we’ll look at some of the research on these drivers and dynamics in more detail.
What is clear is that this relationship is not universal. In the chart, you can see that countries where Islam is the most popular religion — such as those in the Middle East — tend to maintain very high levels of religious identity, despite having high income levels.
Future changes in religious affiliation
It’s interesting to consider how religiosity and the composition of global religions will change in the future. This will largely reflect broader demographic trends across the world.
One clear pattern from the data is that countries with almost universal levels of religiosity today tend to have higher fertility rates — and faster population growth — than those with lower levels of religious affiliation. Countries with extremely low levels of religious identification often have very low fertility rates, often well below the “replacement” level. In other words, their populations are shrinking.
This relationship is shown in the chart below. Countries where religious affiliation is low — such as China, Hong Kong, Japan, and South Korea — tend to cluster at low fertility rates, often well below two children per woman. On the right-hand side, you can see that there are religious countries with low fertility, but there are no countries where the non-religious are the majority and fertility is high.

This matters for how global patterns of religiosity change over time. Even if religious affiliation declines in some countries, population growth is still high in places where religion remains widespread. Over time, this demographic dynamic can offset — or even outweigh — declines elsewhere.
For this reason, many projections (including those from the Pew Research Center) suggest non-religious groups will actually shrink as a share of the global population in the coming decades, and religion will remain widespread globally.10 That’s not because populations are becoming more religious everywhere, but because population growth is fastest in the most religious parts of the world.
Explore the data
Global data on religious affiliation from Pew Research Center
This page features a range of data on religious affiliation: the share of people who are religious, what religion they belong to, and how these patterns have been changing over time.
This is based on self-identification: what people say about their religious affiliation.
In this chart, you can explore this data in more granular detail for each country.
Here are a few insights from these key indicators:
- Levels of religiosity can vary from as high as almost 100% in some countries (such as India) and as low as 10% in others (such as China). You can add and remove other countries to compare.
- The share of people who are religious has declined substantially in many countries between 2010 and 2020, including the United States, Canada, Australia, and much of Europe.
- The geographical distribution of particular religions varies a lot. Christianity is very widespread, with high population shares across Europe, North and South America, and much of Africa. Islam is more concentrated, but still has high shares across multiple regions, including North Africa, the Middle East, and Southeast Asia. Religions such as Hinduism and Buddhism are very geographically concentrated; Hinduism in South Asia and Buddhism in South-East and East Asia.
- Rates and absolute numbers can give a very different perspective. While just 15% of people in India identify as Muslim, compared to 97% in its neighbor, Pakistan, it has almost the same number of Muslims in total.

Data quality and biases
Much of the data used in this topic page is based on self-reports. For religious affiliation, people are asked whether they follow a particular religion and what that religion is. Even data on service attendance or prayer is based on how often someone reports doing so.
In some sense, relying on self-reported data is unavoidable. People’s beliefs are often internal and private; only they can say what they believe or follow. Self-reported survey data also allows researchers to explore religiosity across various dimensions among large populations: affiliation, importance, specific behaviors, and tolerance for other religions.
But it also has its limitations and biases.11 It’s worth keeping these in mind when using this data to understand differences across countries and changes over time.
In countries or communities where religiosity is particularly salient and participation is socially desirable, people may overstate expected behaviors or beliefs. That creates a systematic bias toward expected norms.
People may interpret religious affiliation in different ways. When asked whether they follow a particular religion, some people may respond with their family's or parents’ religion, even if their own beliefs have changed over time. Being “religious” or “non religious” will also differ based on cultural context. As noted elsewhere, many people in East Asia said they were religiously unaffiliated, but many still hold some cultural and religious beliefs or carry out specific practices.12
How questions are framed, the interview structure, and the questions asked beforehand can also make a difference.13 Asking someone, “What is your religion?” may be more likely to force a positive response, than starting with the question “Do you follow a religion?”.
Pew Research notes that Americans reported higher levels of religious participation when the interview was conducted over the phone than when it was completed independently online. If people are asked political questions first, for example, respondents may be more primed to give a politically aligned answer.
These are just some examples of the biases that can affect survey responses. While this survey data allows us to understand global patterns in religious identity and behaviors — and can give some insights into changes over time — it may be inadequate to assess smaller differences between countries, especially with large cultural and political differences.
Featured Data on Religion
Trust
Trust is essential for effective cooperation. How does trust vary between different societies and locations and what matters for levels of trust?
Loneliness and Social Connections
In this topic page, we explore data on loneliness and social connections and review available evidence on the link between social connections and well-being.
Marriages and Divorces
How is the institution of marriage changing? What percentage of marriages end in divorce? Explore global data on marriages and divorces.
Endnotes
For example, there is a debate about a resurgence in religious affiliation among young men in America.
Conrad Hackett et al. (2025). How the Global Religious Landscape Changed From 2010 to 2020. Pew Research Center.
Hackett, Conrad, Marcin Stonawski, Yunping Tong, Stephanie Kramer, Anne Fengyan Shi and Dalia Fahmy. 2025. “How the Global Religious Landscape Changed From 2010 to 2020.” Pew Research Center. doi: 10.58094/fj71-ny11.
In 2020, around 1.3 billion people in China were unaffiliated with any religion. That’s 68% of the 1.9 billion global total.
EVS (2021): EVS Trend File 1981-2017. GESIS Data Archive, Cologne. ZA7503 Data file Version 3.0.0, doi:10.4232/1.14021.
Haerpfer, C., Inglehart, R., Moreno, A., Welzel, C., Kizilova, K., Diez-Medrano J., M. Lagos, P. Norris, E. Ponarin & B. Puranen et al. (eds.). 2022. World Values Survey Trend File (1981-2022) Cross-National Data-Set. Madrid, Spain & Vienna, Austria: JD Systems Institute & WVSA Secretariat. Data File Version 2.0.0, doi:10.14281/18241.27.
Note that we also investigated this relationship when we looked at people who say religion is only “important” rather than “very important”. It holds true there, too: the share saying that religion is “important” was far higher in countries where the share of people who are religiously affiliated was high.
The list of possible responses to the question “Apart from weddings and funerals, about how often do you pray?” was: “several times a day”, “once a day”, “several times a week”, “only when attending religious services”, “only on special holy days”, “once a year”, “less often”, “never, practically never”, “don’t know” or “no answer”. Missing data have been excluded from these response totals.
The share who answered “don’t know” or “no answer” combined was less than 1% in most countries, but reached 7% in a handful of outliers.
Pasquale, F. L., & Kosmin, B. A. (2013). Atheism and the secularization thesis.
Scheitle, C. P., & Corcoran, K. E. (2023). Predictors of Adopting an Atheistic Worldview: An Analysis of Survey Data Containing a Retrospective Measure of Belief in God. Socius.
Strulik, H. (2016). Secularization and Long‐Run Economic Growth. Economic Inquiry.
Ruck, D. J., Bentley, R. A., & Lawson, D. J. (2018). Religious change preceded economic change in the 20th century. Science advances.
Paldam, M., & Gundlach, E. (2013). The religious transition. A long-run perspective. Public Choice, 156(1), 105-123.
Inglehart, R., & Baker, W. E. (2000). Modernization, cultural change, and the persistence of traditional values. American sociological review.
Note that these Pew projections are from 2015, and are now slightly outdated (although the main takeaway likely holds true). We’re currently waiting for their updated estimates.
This paper by Conrad Hackett provides a good overview.
Hackett, C. (2014). Seven things to consider when measuring religious identity. Religion, 44(3), 396-413.
Zhang, C., Brenner, P. S., & He, L. (2022). Measuring religious non-affiliation in China: a comparison of major national surveys in China. International Journal of Public Opinion Research.
Brenner, P. S., LaPlante, J., & Reed, T. L. (2024). Sources of Inconsistency in the Measurement of Religious Affiliation: Evidence from a Survey Experiment and Cognitive Interviews. Sociology of Religion.
Baker, J. O., Hill, J. P., & Porter, N. (2017). Assessing measures of religion and secularity with crowdsourced data from Amazon’s Mechanical Turk. Faithful Measures.
Cite this work
Our articles and data visualizations rely on work from many different people and organizations. When citing this topic page, please also cite the underlying data sources. This topic page can be cited as:
Hannah Ritchie, Lucas Rodés-Guirao, Pablo Arriagada, and Esteban Ortiz-Ospina (2026) - “Religion” Published online at OurWorldinData.org. Retrieved from: 'https://ourworldindata.org/religion' [Online Resource]BibTeX citation
@article{owid-religion,
    author = {Hannah Ritchie and Lucas Rodés-Guirao and Pablo Arriagada and Esteban Ortiz-Ospina},
    title = {Religion},
    journal = {Our World in Data},
    year = {2026},
    note = {https://ourworldindata.org/religion}
}
Reuse this work freely
All visualizations, data, and articles produced by Our World in Data are completely open access under the Creative Commons BY license. You have the permission to use, distribute, and reproduce these in any medium, provided the source and authors are credited.
The data produced by third parties and made available by Our World in Data is subject to the license terms from the original third-party authors. We will always indicate the original source of the data in our documentation, so you should always check the license of any such third-party data before use and redistribution.
All of our charts can be embedded in any site.