Vaccination
This page was first published in July 2015 and last revised in August 2025.
Vaccines are one of the most powerful tools in public health.
They have saved hundreds of millions of lives by preventing deadly diseases like measles, polio, and smallpox. Before vaccines, these infections were common, and surviving them often meant facing severe complications or lifelong disability.
Vaccines work by safely training the immune system to recognize and fight pathogens before they can cause serious illness. When enough people are vaccinated, entire communities are protected, including those who can’t get vaccinated.
But challenges remain. Not everyone has access to vaccines, poor scientific understanding can reduce trust and uptake, and supply shortages still put children at risk in many parts of the world.
The world can make more progress by improving access, strengthening health systems, and developing safe and effective vaccines for more diseases.
This page explores the history and impact of vaccination and presents global data and research on vaccine development, coverage, and effectiveness.
See all our articles on vaccination ↓
See key charts on vaccination ↓
Vaccine technology has advanced dramatically
The history of vaccines has involved many breakthroughs by many scientists. The first came in 1796, when Edward Jenner created the first smallpox vaccine, using cowpox to trigger immunity. His idea laid the foundation for future vaccines.1
After the smallpox vaccine, it took almost a century for the next vaccine to be developed, this time against rabies. This was because scientists didn’t yet understand what caused diseases and how they spread.
As germ theory was established in the late nineteenth century, scientists like Louis Pasteur and Robert Koch were able to develop vaccines for rabies, cholera, and anthrax.2 Over the twentieth century, vaccines were invented for many more diseases, including polio, measles, and diphtheria, and have saved millions of lives worldwide.
The chart below shows how long it took between when pathogens were identified as the cause of a disease and when the vaccine against them was introduced.
Today, researchers can design effective vaccines with better tools than before.
For example, advanced microscopes allow scientists to visualize viruses down to the level of atoms, helping them design vaccines that target the most vulnerable parts of a virus.3 Genome sequencing enables researchers to quickly identify new pathogens and track their mutations in real-time, ensuring vaccines can be updated as pathogens evolve. Meanwhile, virus-like particles are developed to mimic real viruses without carrying harmful genetic material, making them a safer way to stimulate strong immune responses.4
These advances have helped scientists develop vaccines for more diseases like rotavirus, pneumococcal disease, respiratory syncytial virus, and Ebola. During the COVID-19 pandemic, advances in mRNA vaccine technology made it possible to develop and update vaccines in months rather than years.
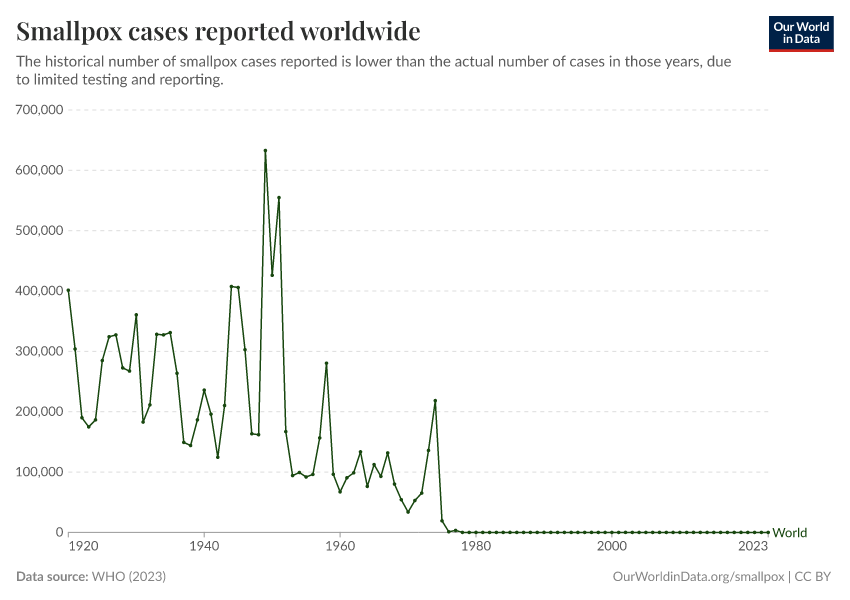
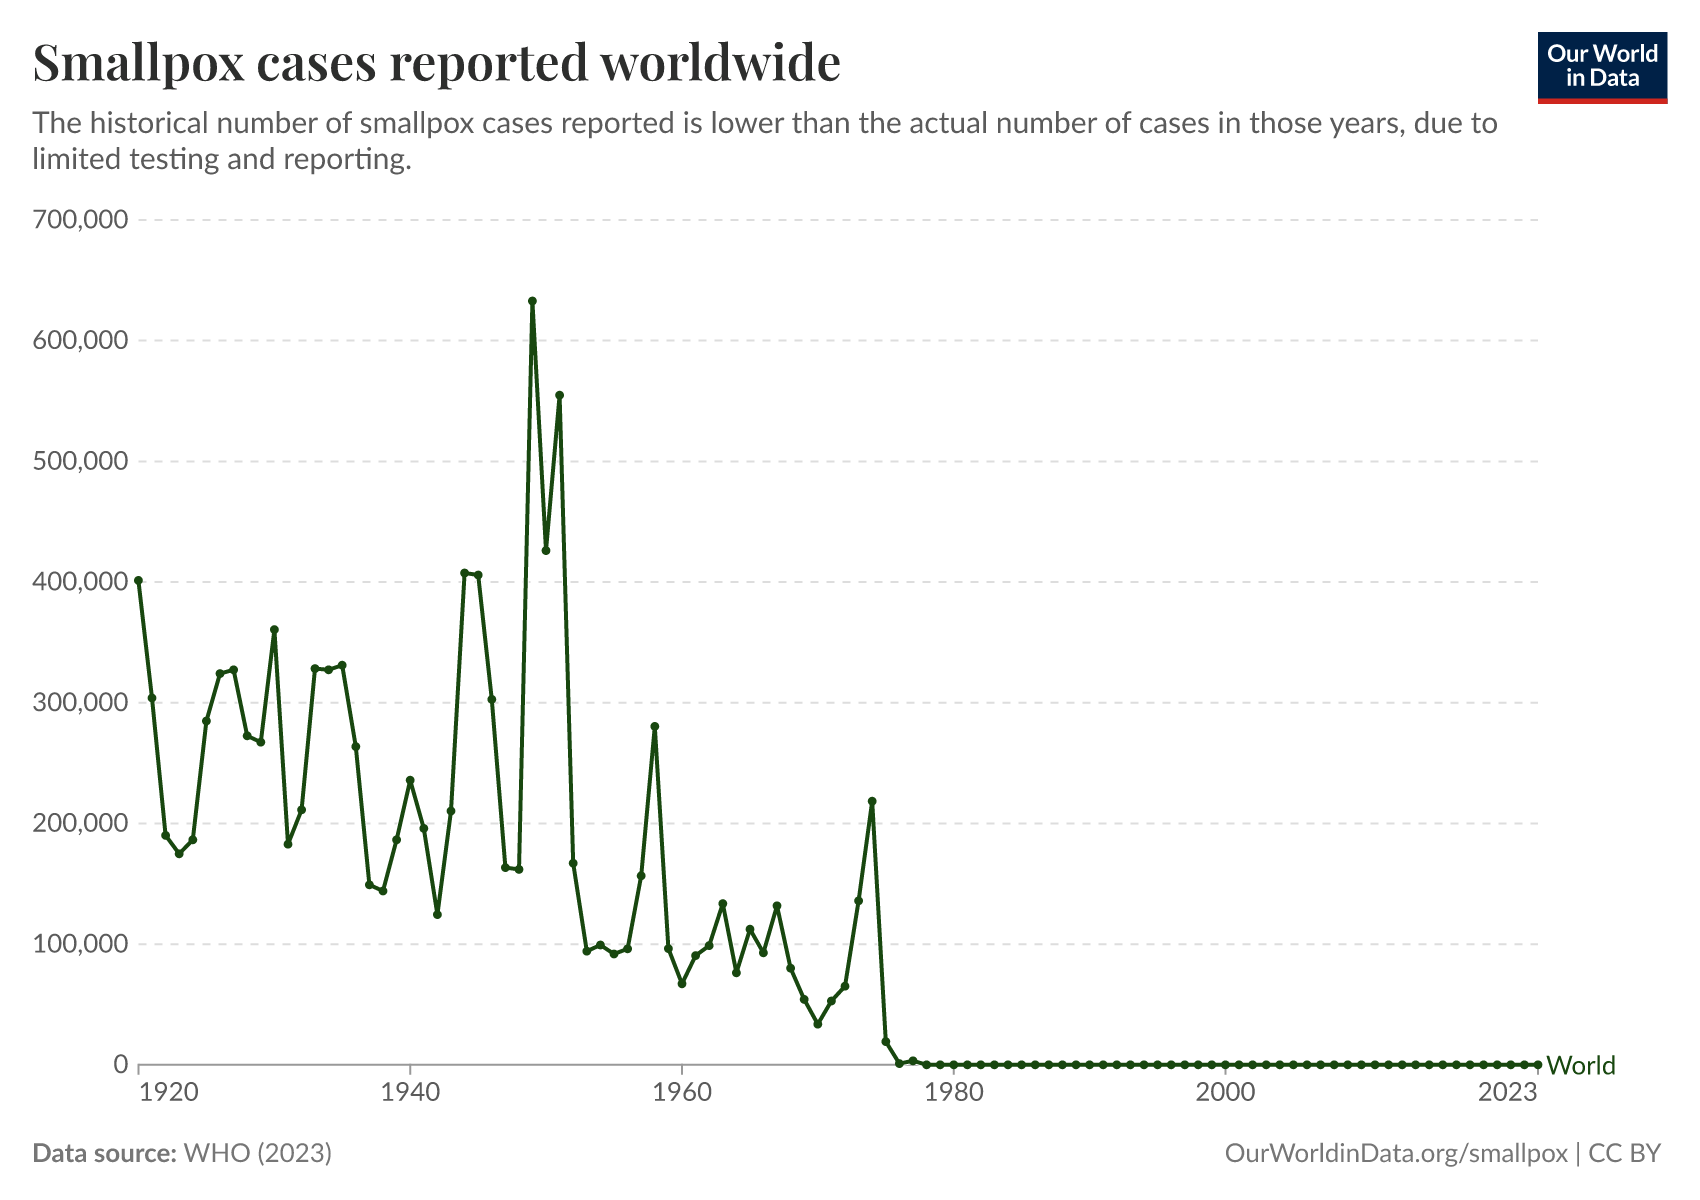
Vaccination helped eradicate smallpox worldwide
The greatest example of the success of vaccination has been smallpox, which was eradicated worldwide in 1980 through vaccination. Because the virus only infected humans (but not other animals), had distinguishable symptoms, and the vaccine was cheap and effective, health workers could effectively contain the spread of the virus.5
The chart below shows the number of countries where smallpox was still present (“endemic”) over time, and the key events that led to its eradication, including the WHO’s resolution to eradicate the disease in 1959, the intensified eradication campaign from 1967, and the last recorded case in 1977.
Read more on our page on smallpox:
Vaccines have massively reduced the rates of measles, polio, and many other diseases
Before vaccines, diseases like measles, polio, and smallpox could only be controlled through natural immunity, meaning surviving the infection. While this sometimes provided long-term protection, it came at a terrible cost: millions died, and many who survived faced lifelong complications.6
Some societies tried early forms of immunization, like “variolation” for smallpox. Still, these methods were often risky and unreliable: children typically endured a week of severe disease, and a fraction died from it.7
Vaccines changed this by providing a safe, controlled way to prepare the immune system. Instead of facing the disease, people could develop immunity through exposure to a weakened or inactive form of a virus. This form can’t cause infection, but it trains the immune system to quickly recognize and respond to the pathogen in the future. Even more importantly, vaccines have increased immunity across whole populations, stopping diseases from spreading widely.
The concept of “herd immunity” is key to this success: when enough people are vaccinated, a pathogen is much less able to multiply within people and spread to others. This protects those who get the vaccine and those who can’t, like newborns, people with certain immune conditions, or those on certain medications that suppress the immune system (including some chemotherapies used to treat cancer).
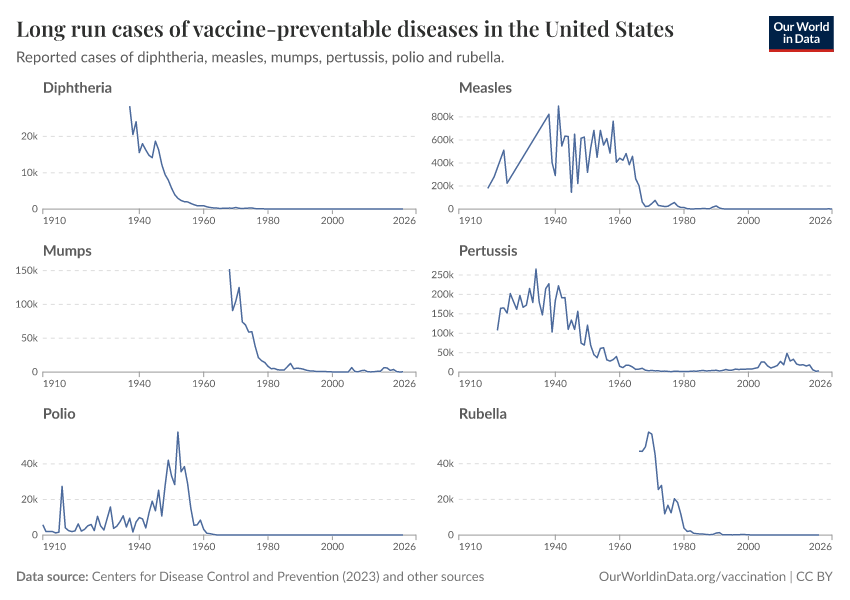
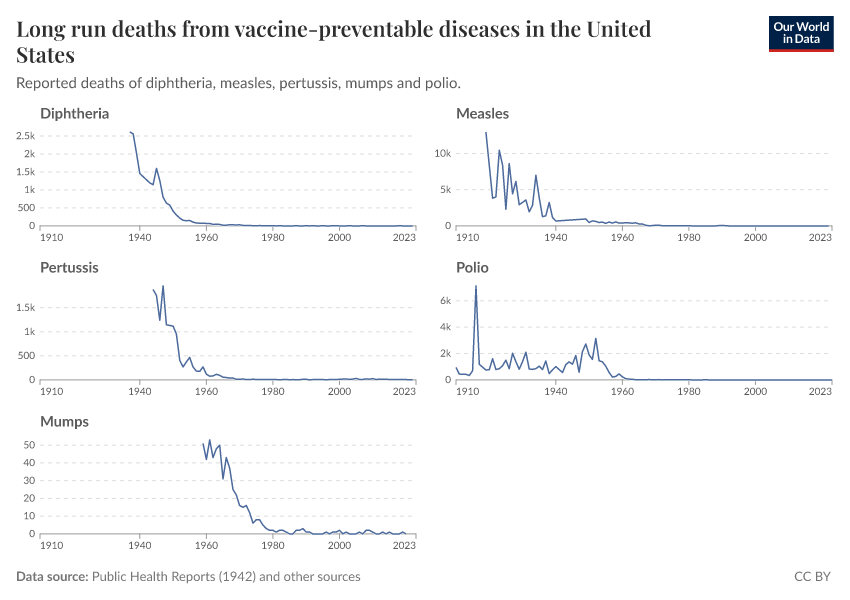
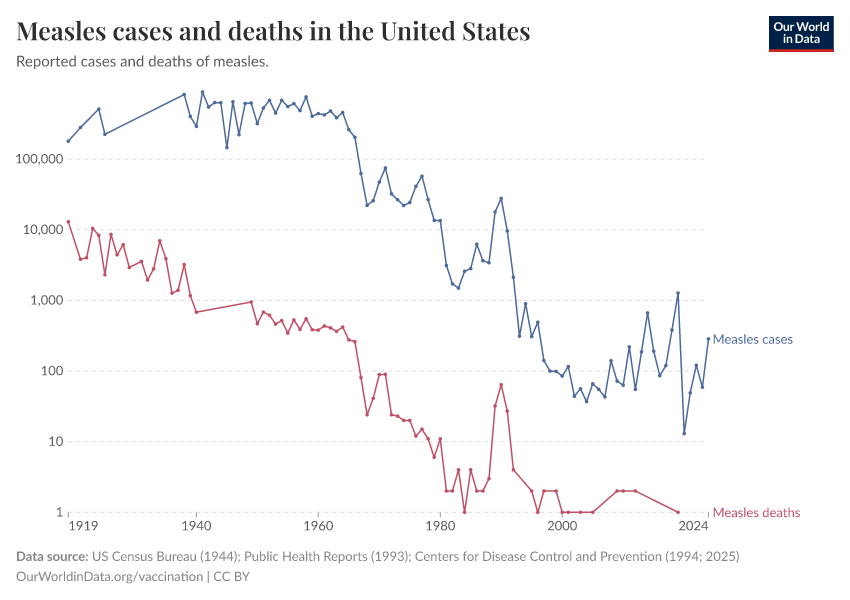
The chart here summarizes the reduction in cases and deaths in many vaccine-preventable diseases in the United States after introducing each vaccine. This data was published by Roush and Murphy (2007).8
The US has achieved a 100% reduction of cases and deaths for several diseases, and a very substantial decrease for many others.
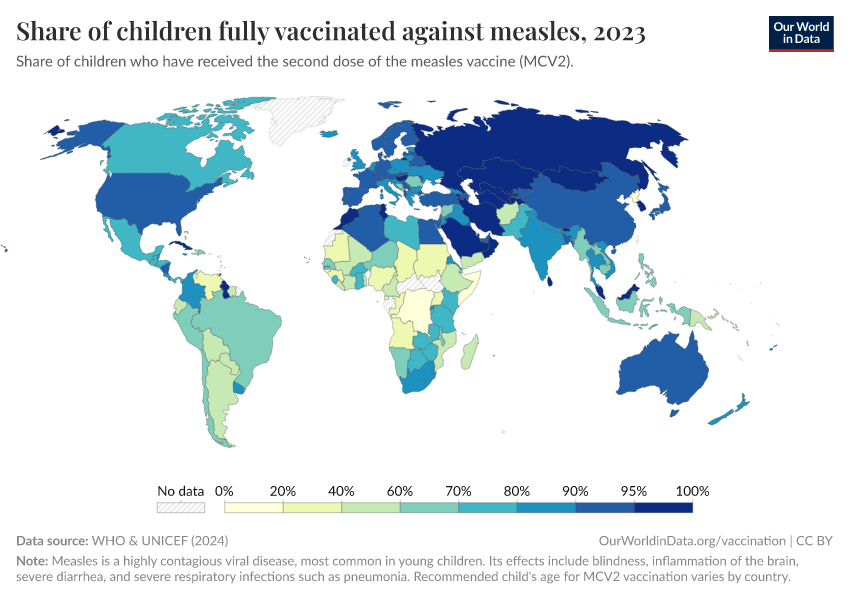
For diseases that spread easily, like measles, very high vaccination coverage — typically above 90% — is needed to reach herd immunity and prevent outbreaks. That became possible thanks to John Enders, a virologist who developed the first effective measles vaccine. Enders and his team weakened the virus in the lab to stimulate immunity without causing severe disease.10 The highly effective measles vaccines used today are derived from the original strain in Enders’ vaccine.11
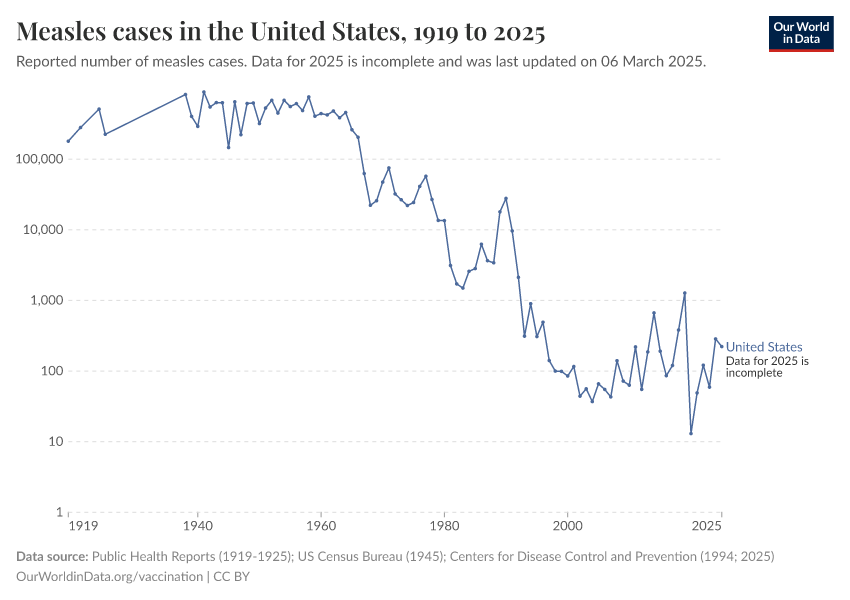
The impact was dramatic. Before vaccination, the measles virus infected most children, killing millions12, and causing complications in many who survived, like pneumonia and encephalitis (brain swelling), and suppressing immune cells, which meant that people became vulnerable to many otherwise mild infections.13 After Enders’ vaccine was introduced in 1963 and became widely used, measles cases plummeted.
The chart below shows cases in the United States, which has great state-level data since the early 20th century.
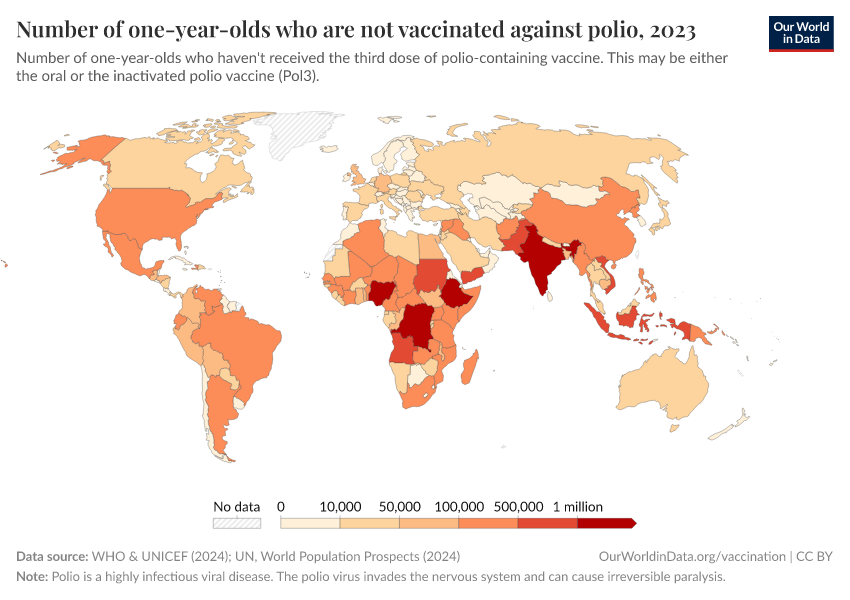
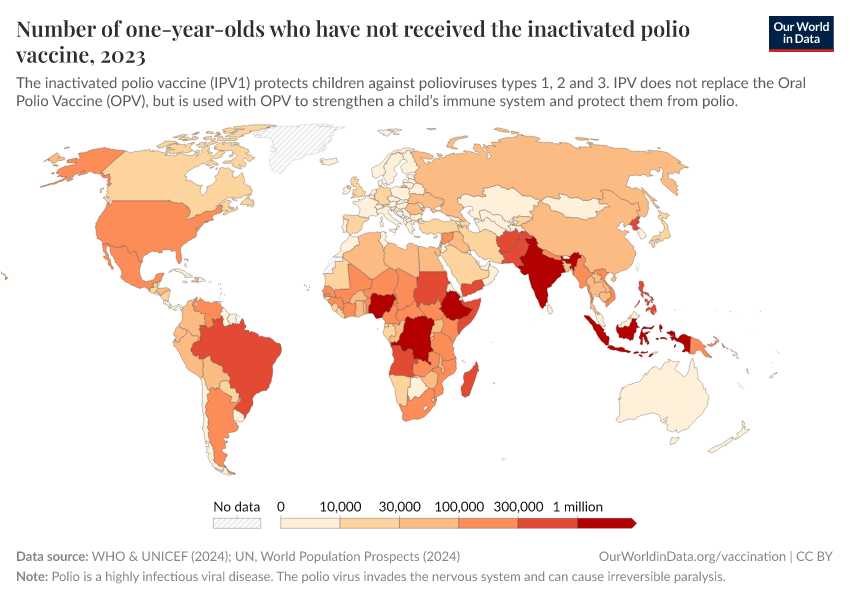
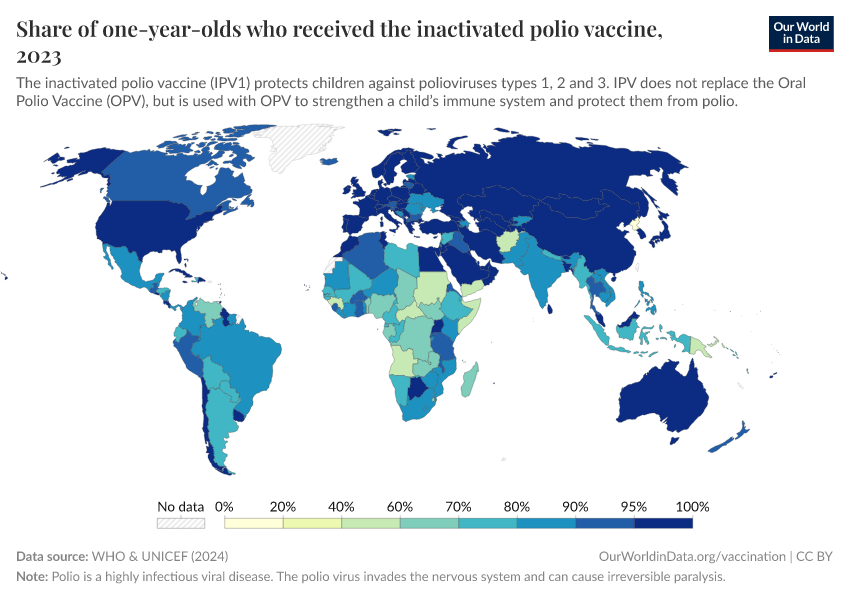
Polio is another example. The poliovirus spreads through contaminated water, attacks the nervous system, and can cause breathing problems and paralysis. Like measles, polio can spread silently among those with mild or no symptoms, making high vaccination coverage essential. Jonas Salk’s inactivated polio vaccine, introduced in 1955, and Albert Sabin’s oral polio vaccine, introduced in 1960, stopped transmission and dramatically reduced cases.
Through large-scale vaccination efforts worldwide, eradication is now within reach for polio.

Vaccines have saved hundreds of millions of lives worldwide
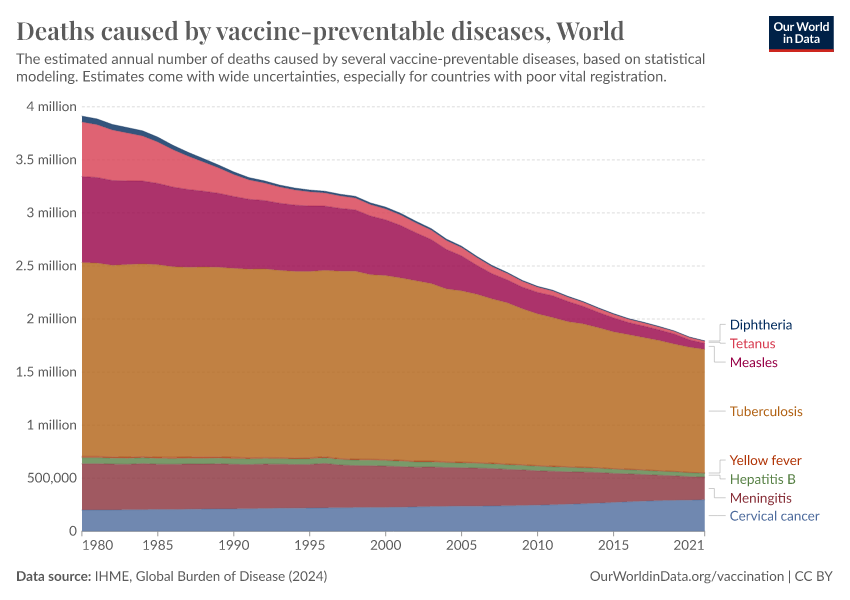
This chart shows the estimated number of deaths each year since 1980 from various diseases against which vaccines are available.

It shows that deaths from several diseases — including diphtheria, tetanus, and measles — have dropped dramatically. This reflects the success of widespread childhood immunization programs.
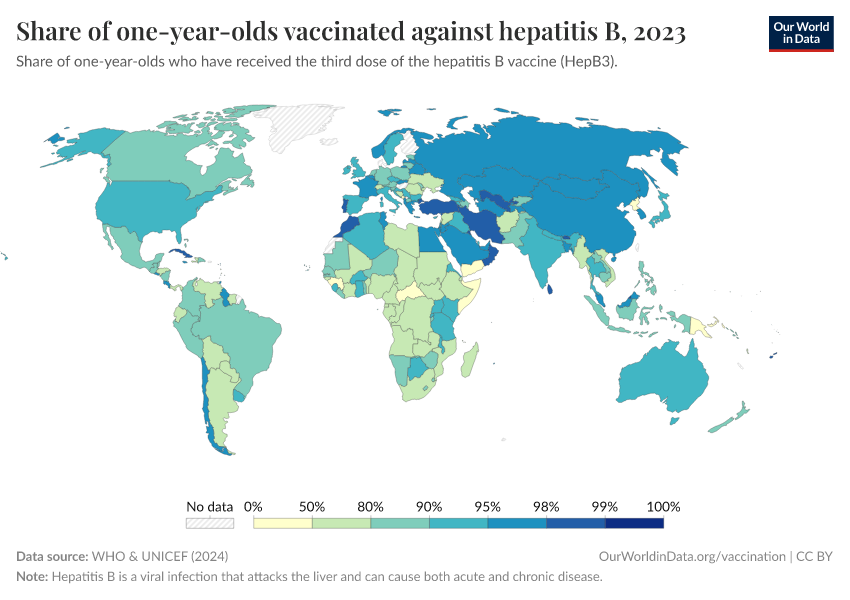
In contrast, the decline in deaths from diseases like hepatitis B and cervical cancer has been more gradual. This is because these diseases typically cause illness and death much later in life, often decades after infection. As a result, the benefits of vaccination take longer to become visible in mortality trends, especially when it was introduced in recent decades.
Additionally, the world’s population has grown significantly and is aging. Since both hepatitis B and cervical cancer mainly cause deaths in adults, a larger and older population increases the total number of deaths, even though the mortality rate within each birth cohort is declining.
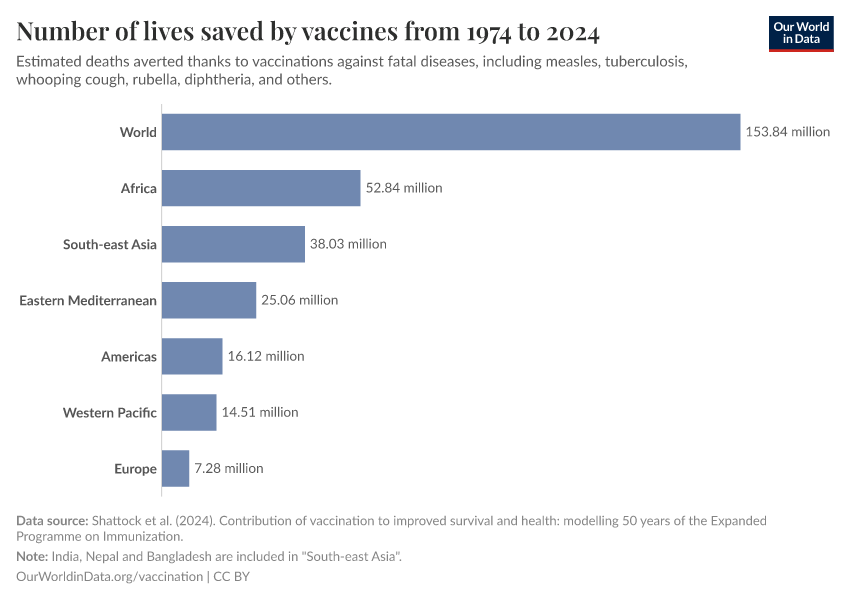
So, how many lives have been saved by vaccinations in total?
Researcher Andrew Shattock and his colleagues used data on childhood vaccinations — including their impact on the risk and spread of those infectious diseases — and estimated that routine vaccinations prevented 154 million deaths worldwide in just the last fifty years.14 This is shown in the chart, with the breakdown by disease.
Measles vaccination alone has saved 94 million lives, making it the most impactful vaccine. Other major contributors include vaccines against tetanus, whooping cough, tuberculosis, and polio.

Read more in our article:
Most infants worldwide receive vaccinations annually
In the previous section, we saw how over a hundred million lives have been saved by childhood vaccinations over the last fifty years. That has been possible thanks to dramatically higher vaccination rates in recent decades.
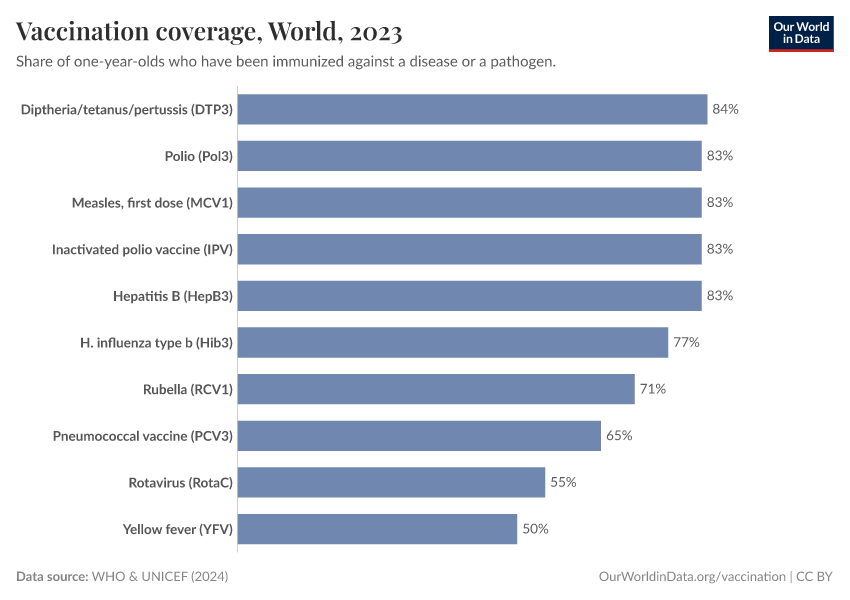
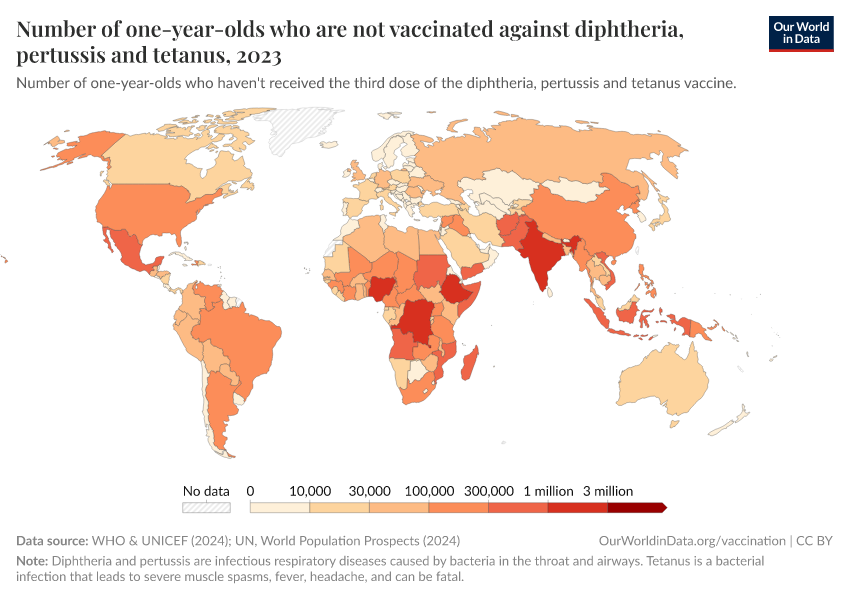
A key measure of this success is the DTP vaccine, which protects against diphtheria, tetanus, and pertussis. Because it requires three doses, DTP coverage is often used as a benchmark for how well countries deliver routine vaccinations. Today, over 80% of infants worldwide — over a hundred million babies — receive the full course annually, a dramatic improvement from past decades. This is shown in the chart below.
You can explore the data on vaccine coverage in more depth with the drop-down menus below.

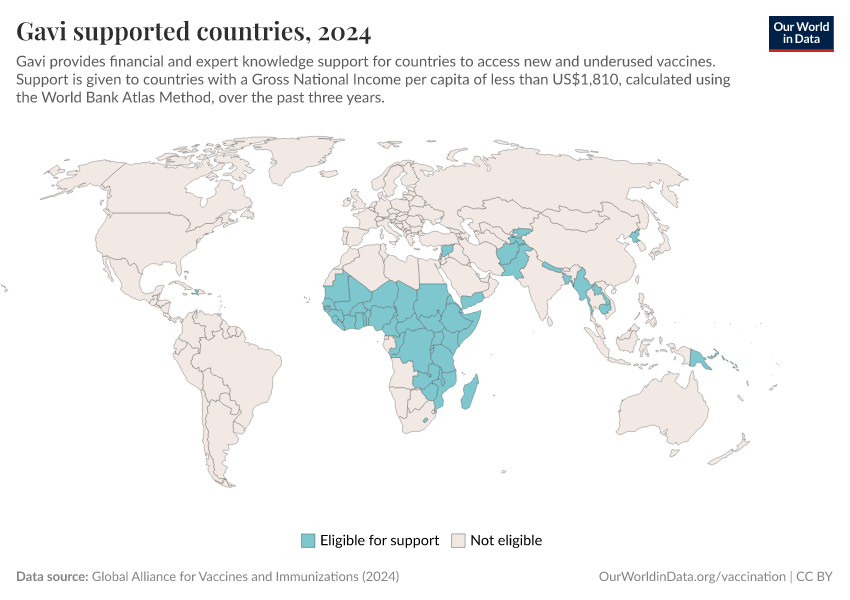
Advances in vaccine technology, massive global immunization campaigns, and political commitments have all contributed. Initiatives like Gavi, the WHO’s Expanded Programme on Immunization, and national vaccination programs have helped lower costs, improve distribution, and train healthcare workers.
While there is still work to be done — maintaining high vaccination rates and reaching the last 20% of children — global vaccination stands as one of the greatest public health achievements in history.
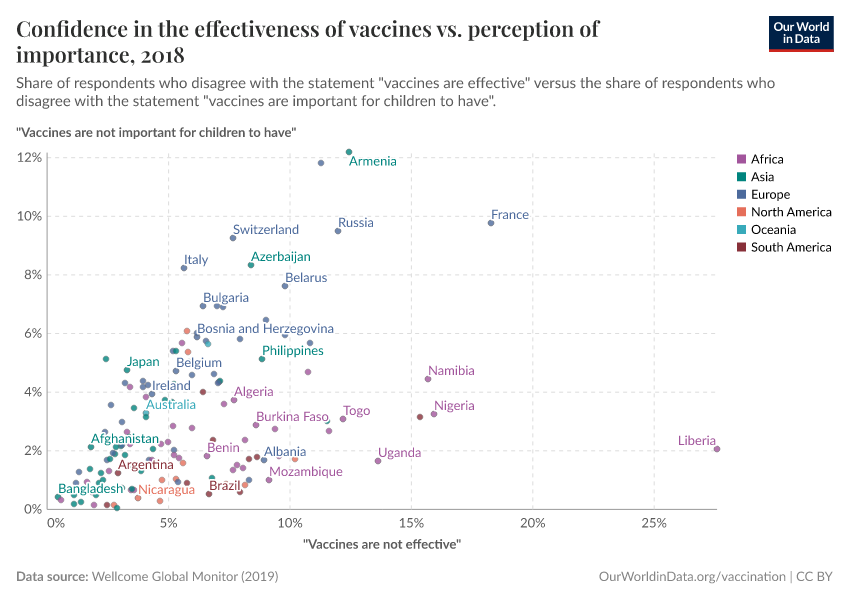
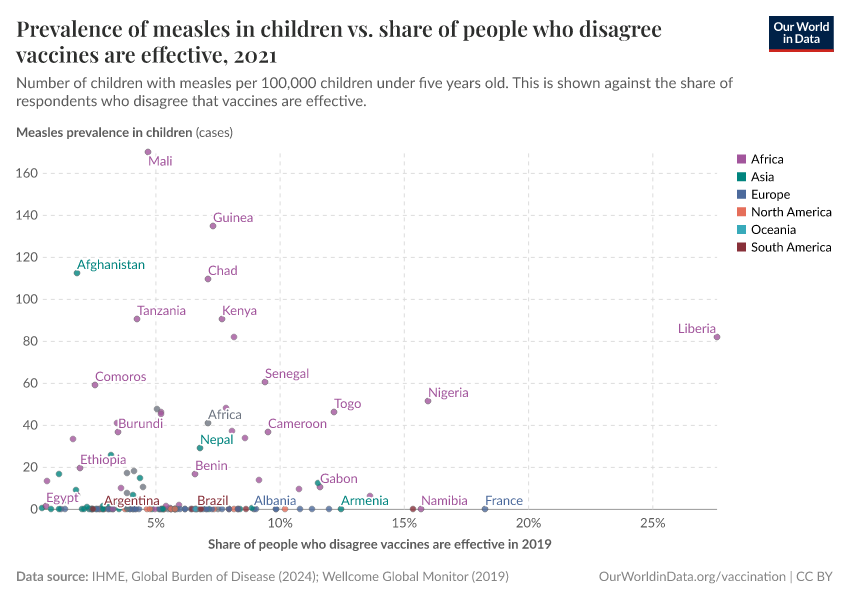
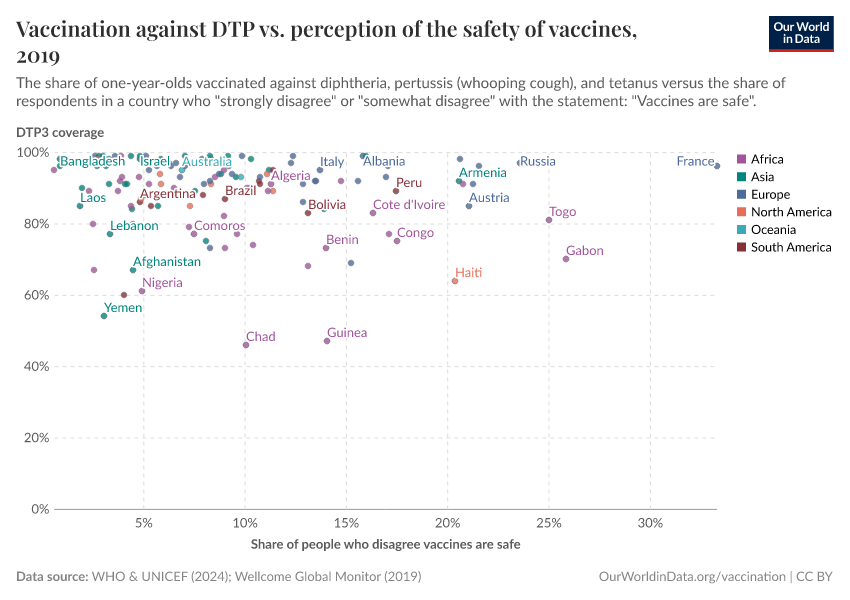
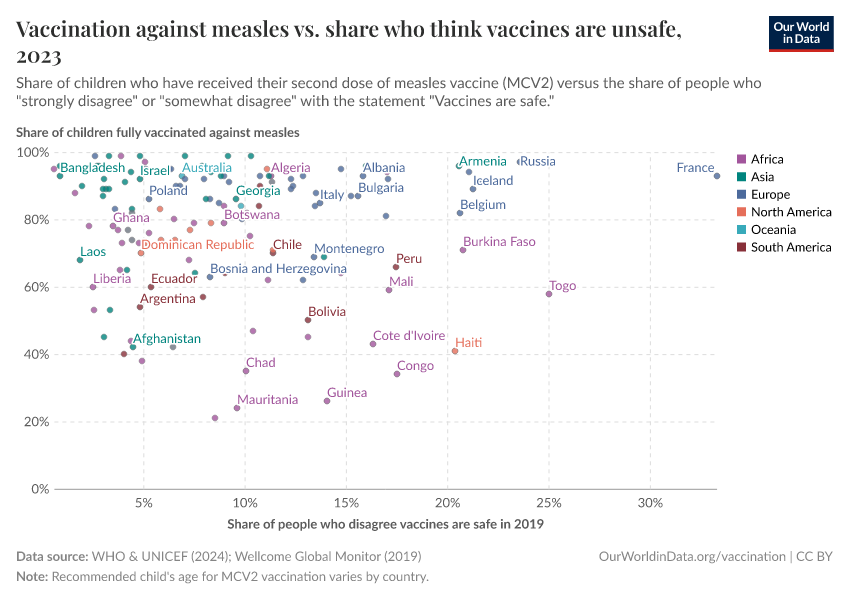
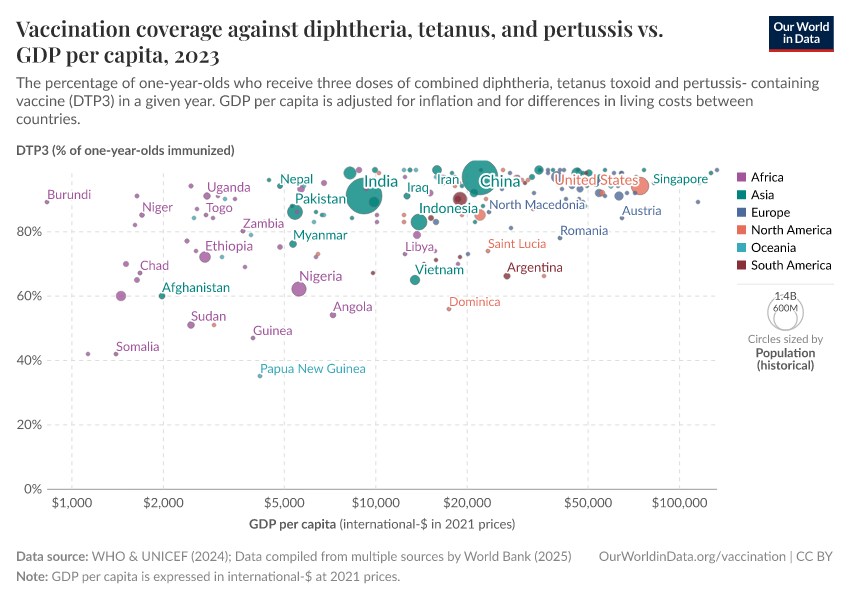
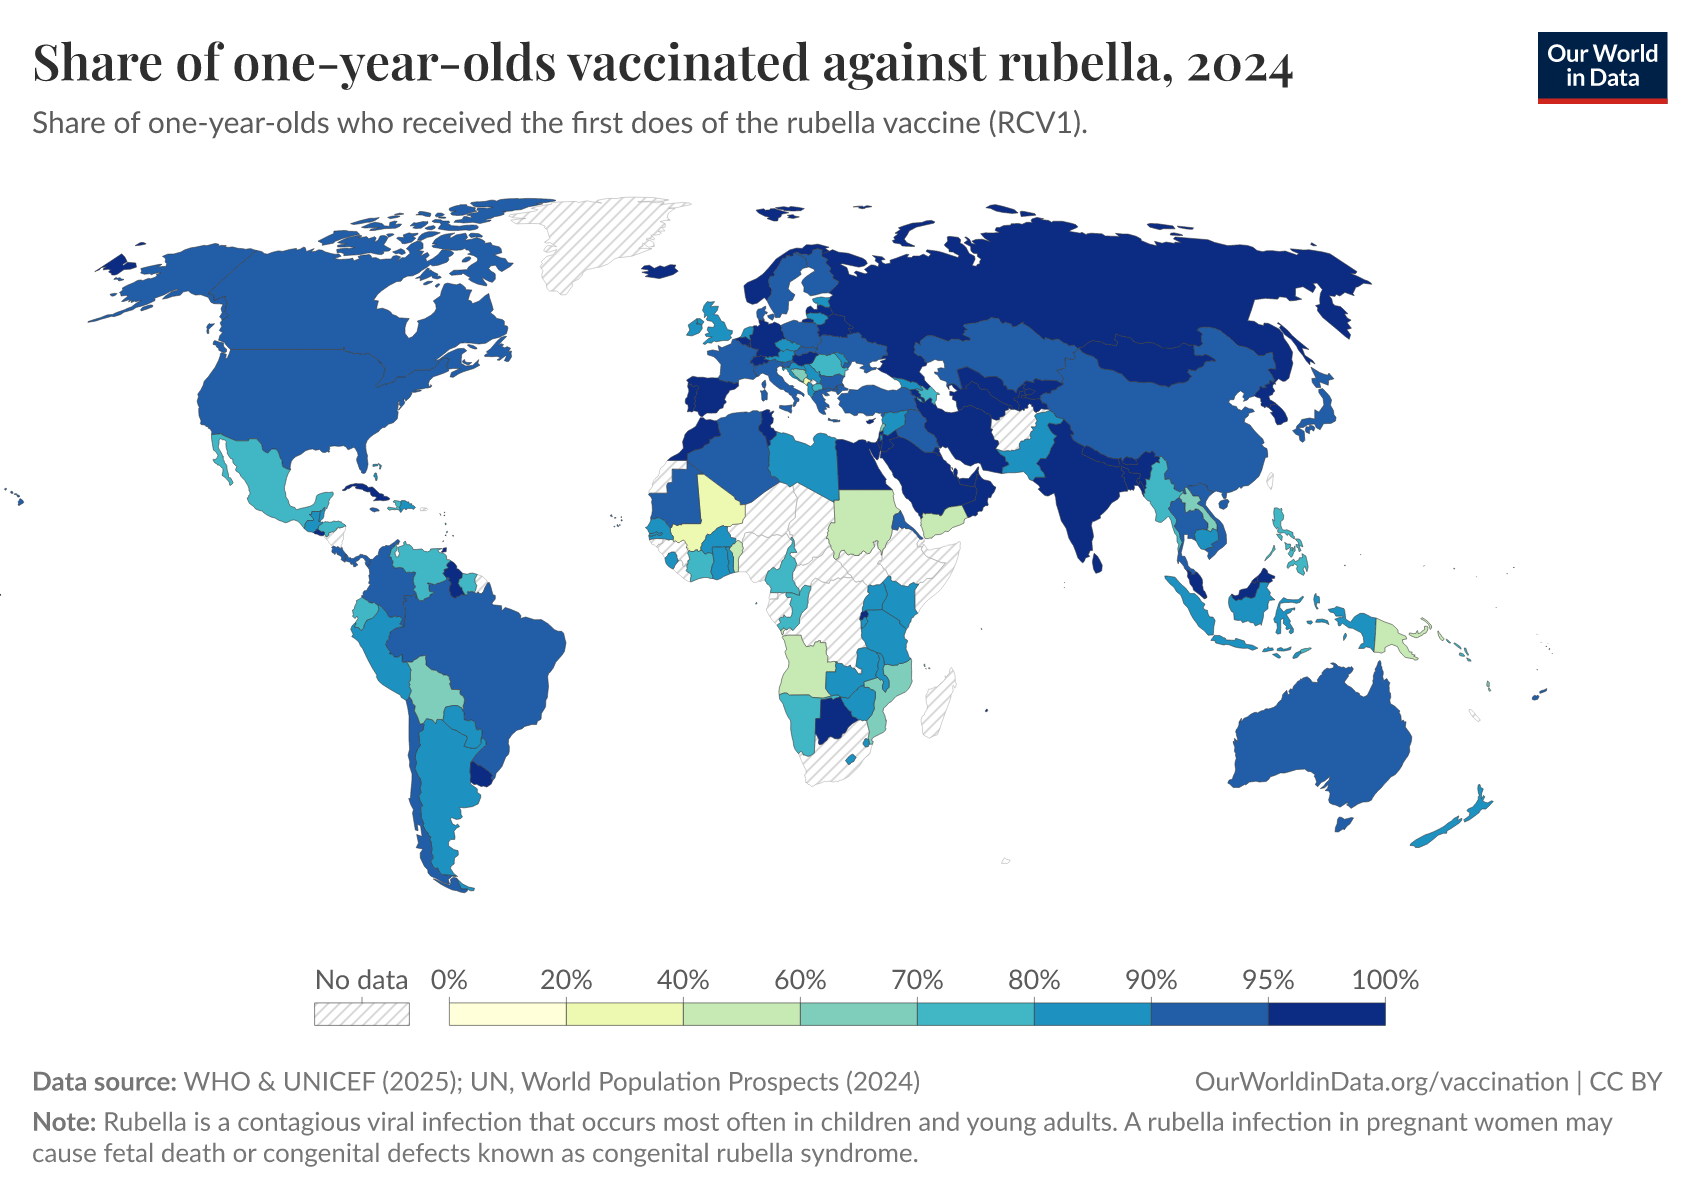
Poorer countries often have lower vaccination rates, but not due to greater skepticism
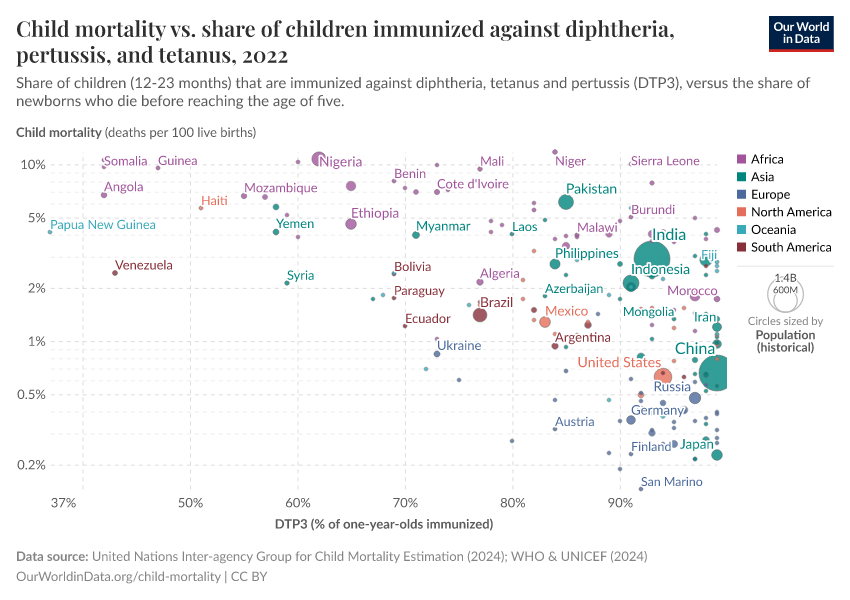
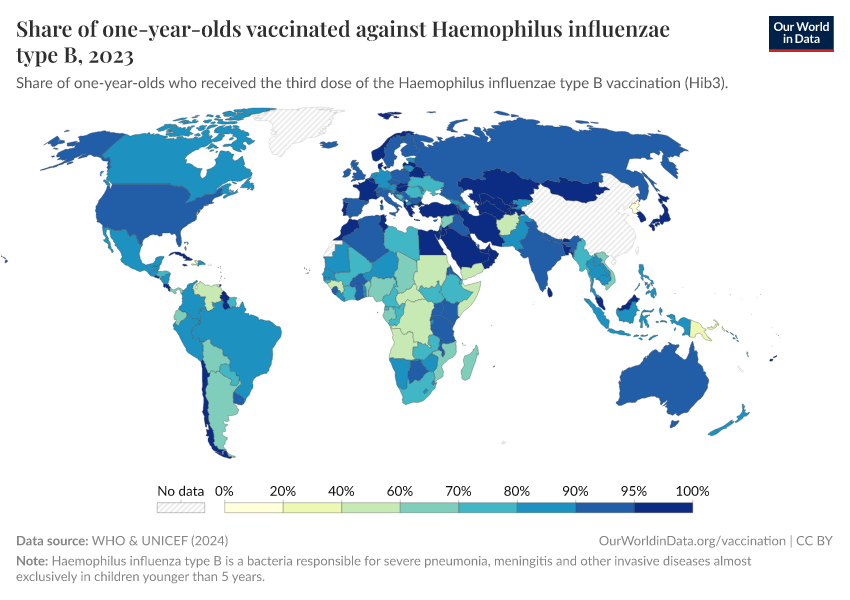
The first map below shows the share of infants who receive DTP vaccinations in each country.
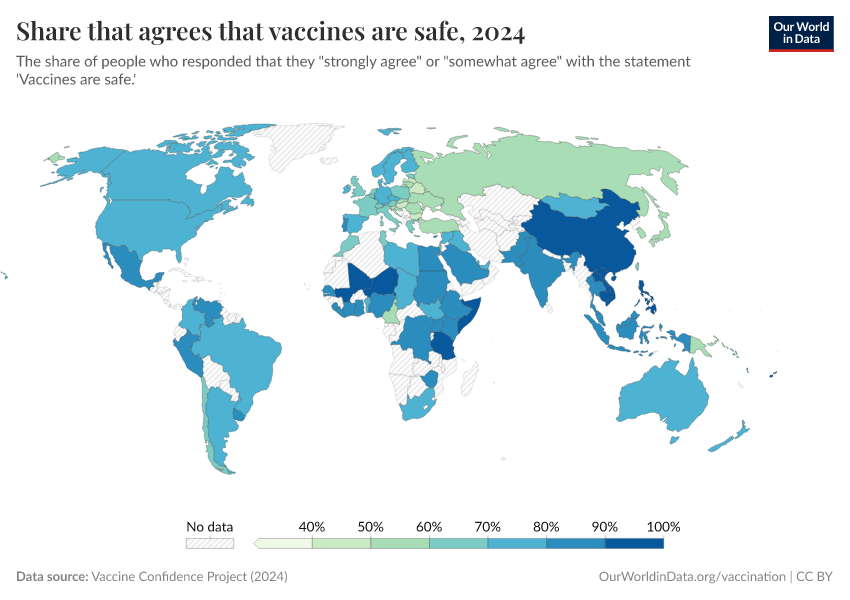
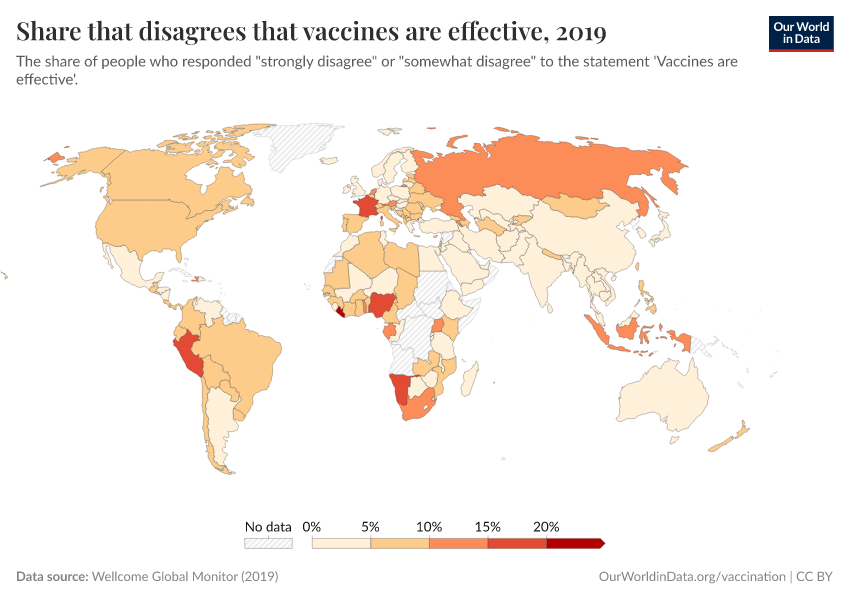
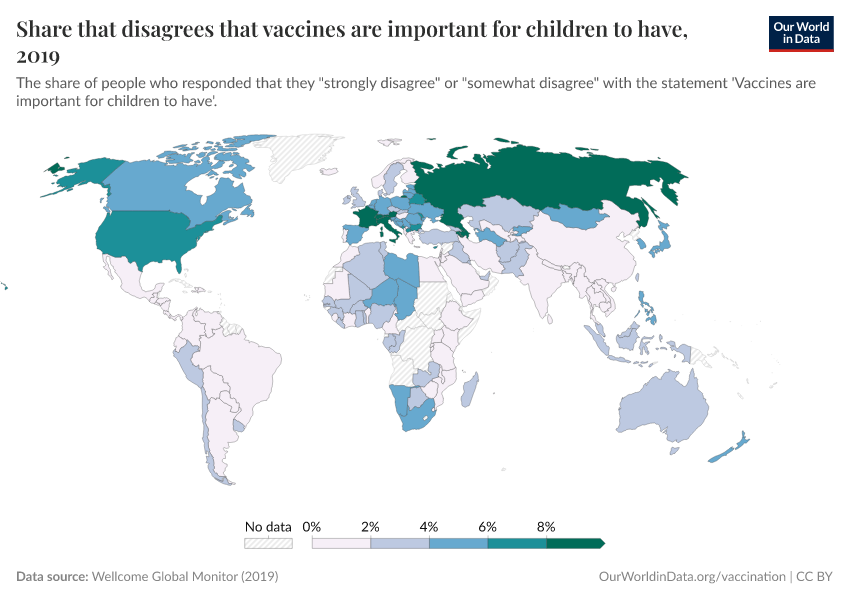
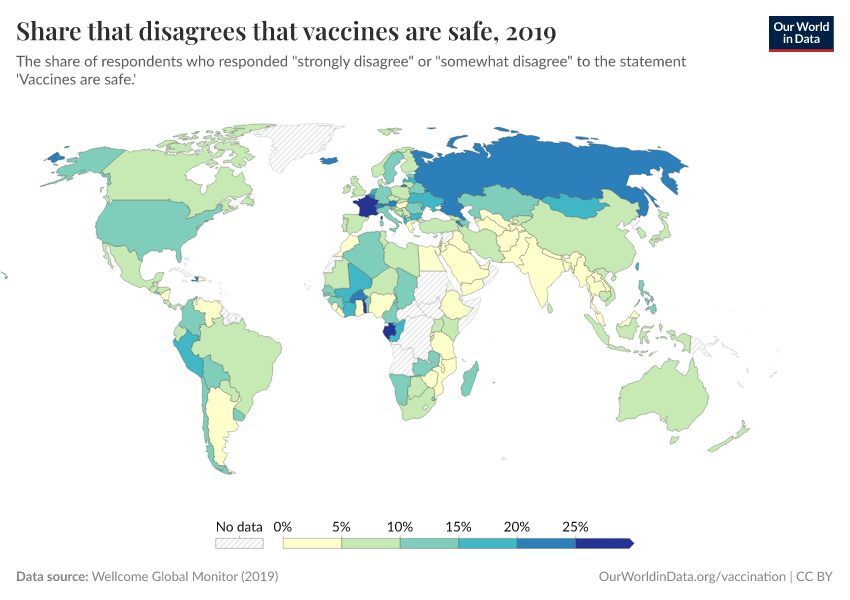
As the map shows, vaccination rates tend to be higher in countries in Europe, Asia, and North America than in Africa and South America. However, as the second map shows, this is not because of lower confidence in vaccines.
Many countries where more people agree that vaccines are important for children also have lower vaccination rates. This points to other reasons for lower vaccination coverage rates, including lower access and supply disruptions in vaccinations, as described in the next section.
Vaccine skepticism plays a role in some places, but surveys show vaccine confidence is generally high in many lower-income countries. In contrast, some higher-income countries, where coverage is higher, report lower public trust in vaccines.


Read more in our article on vaccine attitudes:
Disruptions in vaccination supplies are common in poorer countries
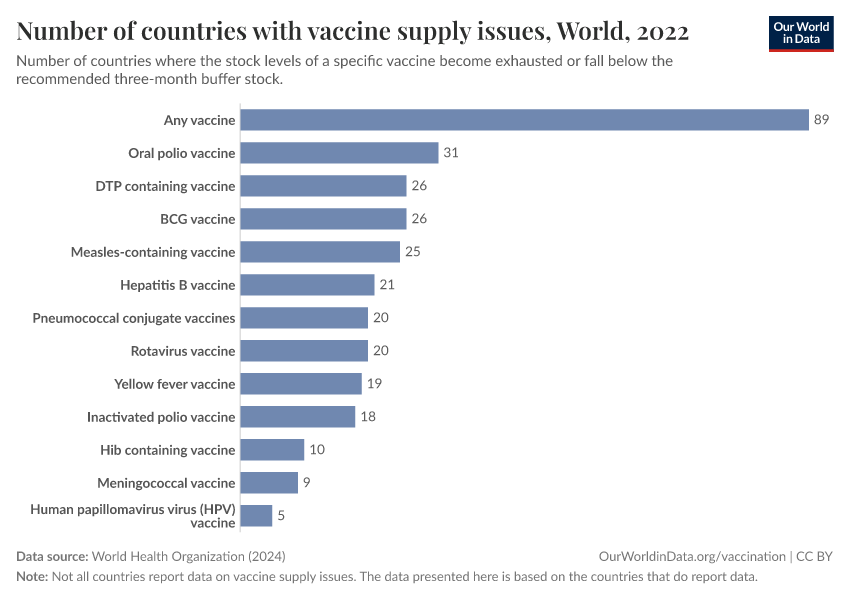
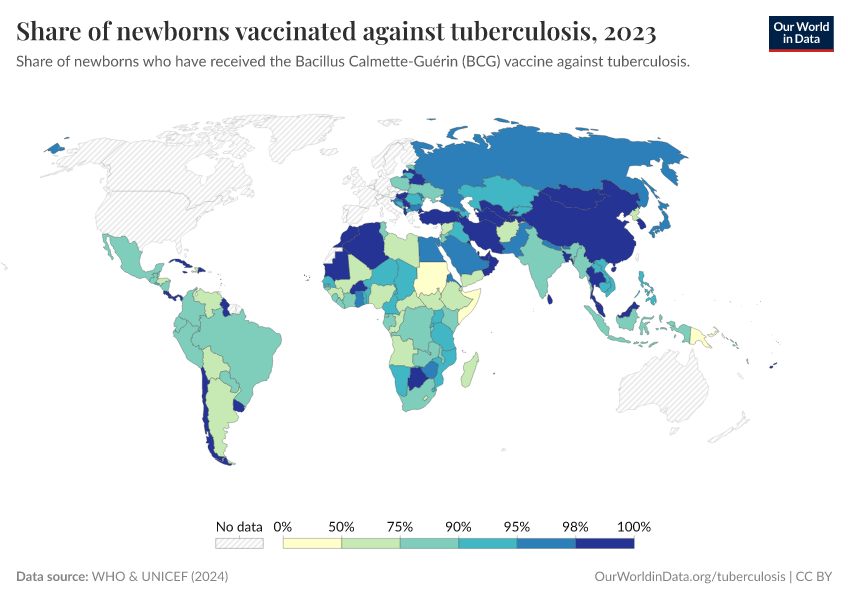
Although global vaccination efforts have made major progress, supply chain disruptions are still common, especially in low-income countries. The WHO recommends a three-month buffer stock of vaccines, but many countries struggle to maintain this, leading to shortages that can leave millions of children unprotected.
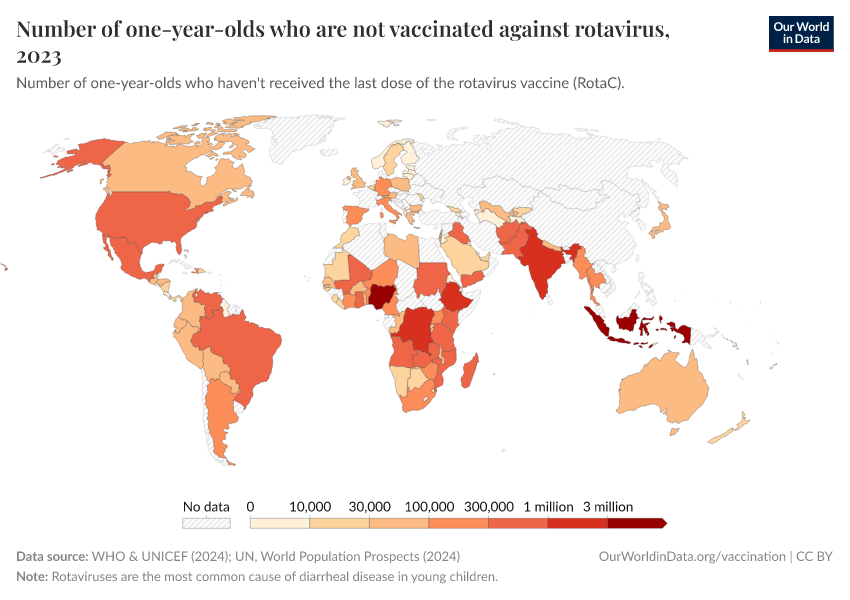
The chart shows that around 90 countries reported shortages of at least one vaccine in 2022. The most common were oral polio, DTP, and BCG vaccines — critical for preventing polio and tuberculosis. Even vaccines for diseases like rotavirus (the most common cause of death from diarrheal disease) and pneumococcal disease faced shortages, though to a lesser extent.

These disruptions occur for several reasons. Weak healthcare infrastructure and unreliable cold storage systems make it difficult to keep vaccines at the right temperature. Political instability, conflicts, funding shortages, and economic crises can also disrupt vaccine deliveries. Supply chain bottlenecks — such as production delays, limited manufacturing, and transportation issues — also play a role, especially in remote or conflict-affected areas.
These shortages delay vaccinations and increase the risk of disease outbreaks.
Research & Writing
Our articles on vaccination
May 6, 2024
Vaccines have saved 150 million children over the last 50 years
July 20, 2020
Our history is a battle against the microbes: we lost terribly before science, public health, and vaccines allowed us to protect ourselves
June 16, 2025
Measles leaves children vulnerable to other diseases for years
April 21, 2025
How effective and safe are measles vaccines?
May 19, 2025
Measles vaccines save millions of lives each year
November 4, 2024
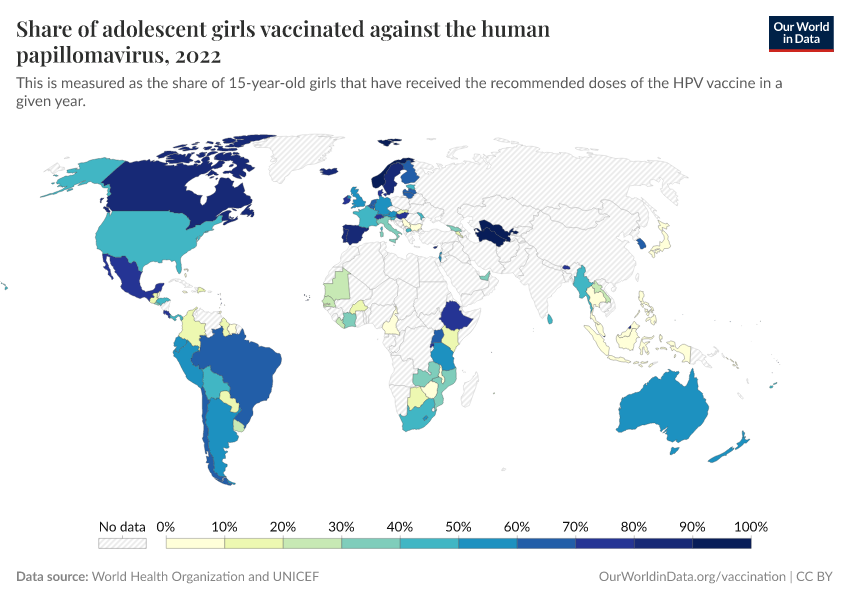
HPV vaccination: How the world can eliminate cervical cancer
March 19, 2015
Reduction of cases and deaths of vaccine-preventable diseases in the US
August 1, 2019
How many people support vaccination across the world?
August 1, 2019
Vaccine skepticism and what to do about it
June 11, 2021
Which countries have mandatory childhood vaccination policies?
Key Charts on Vaccination
See all charts on this topic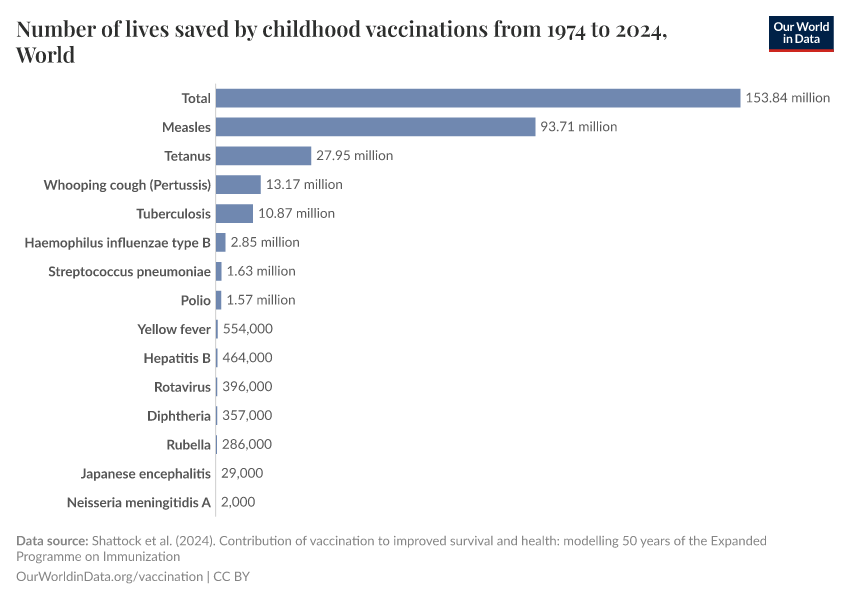


Featured Data on Vaccination
Endnotes
Baxby, D. (2011). Edward Jenner’s Role in the Introduction of Smallpox Vaccine. In S. A. Plotkin (Ed.), History of Vaccine Development (pp. 13–19). Springer New York. https://doi.org/10.1007/978-1-4419-1339-5_3
Susser, M., & Stein, Z. (2009). Eras in Epidemiology. Oxford University Press. https://doi.org/10.1093/acprof:oso/9780195300666.001.0001
Courtland, R. (2018). The microscope revolution that’s sweeping through materials science. Nature, 563(7732), 462–464. https://doi.org/10.1038/d41586-018-07448-0
Hilleman, M. R. (2000). Vaccines in historic evolution and perspective: A narrative of vaccine discoveries. Vaccine, 18(15), 1436–1447. https://doi.org/10.1016/S0264-410X(99)00434-X
Henderson, D. A. (2011). The eradication of smallpox – An overview of the past, present, and future. Vaccine, 29, D7–D9. https://doi.org/10.1016/j.vaccine.2011.06.080
Parrino, J., & Graham, B. (2006). Smallpox vaccines: Past, present, and future. Journal of Allergy and Clinical Immunology, 118(6), 1320–1326. https://doi.org/10.1016/j.jaci.2006.09.037
Leung, A. K. C. (2011). “Variolation” and Vaccination in Late Imperial China, Ca 1570–1911. In S. A. Plotkin (Ed.), History of Vaccine Development (pp. 5–12). Springer New York. https://doi.org/10.1007/978-1-4419-1339-5_2
Baxby, D. (2011). Edward Jenner’s Role in the Introduction of Smallpox Vaccine. In S. A. Plotkin (Ed.), History of Vaccine Development (pp. 13–19). Springer New York. https://doi.org/10.1007/978-1-4419-1339-5_3
Leung, A. K. C. (2011). “Variolation” and Vaccination in Late Imperial China, Ca 1570–1911. In S. A. Plotkin (Ed.), History of Vaccine Development (pp. 5–12). Springer New York. https://doi.org/10.1007/978-1-4419-1339-5_2
Roush and Murphy (2007) — Historical comparisons of morbidity and mortality for vaccine-preventable diseases in the United States. In the Journal of the American Medical Association, 298, 18, 2155–2163. Available online.
These data are taken from the research paper Roush and Murphy (2007) — Historical comparisons of morbidity and mortality for vaccine-preventable diseases in the United States. In the Journal of the American Medical Association, 298, 18, 2155–2163. Available online.
The vaccines against the diseases listed from diphtheria to tetanus were licensed before 1980. The vaccines against the last 5 diseases were only licensed or recommended between 1980 and 2005.
Katz, S. L., Enders, J. F., & Holloway, A. (1962). The development and evaluation of an attenuated measles virus vaccine. American Journal of Public Health and the Nations Health, 52(Suppl_2), 5-10. Available online.
Katz, S. L. (2009). John F. Enders and measles virus vaccine—a reminiscence. In Measles: History and Basic Biology (pp. 3-11). Berlin, Heidelberg: Springer Berlin Heidelberg. Available online.
Parks, C. L., Lerch, R. A., Walpita, P., Wang, H.-P., Sidhu, M. S., & Udem, S. A. (2001). Comparison of Predicted Amino Acid Sequences of Measles Virus Strains in the Edmonston Vaccine Lineage. Journal of Virology, 75(2), 910–920. https://doi.org/10.1128/JVI.75.2.910-920.2001
World Health Organization (2024). Fact sheets: Measles. Available online.
De Vries, R. D., Mesman, A. W., Geijtenbeek, T. B., Duprex, W. P., & De Swart, R. L. (2012). The pathogenesis of measles. Current Opinion in Virology, 2(3), 248–255. https://doi.org/10.1016/j.coviro.2012.03.005
Shattock, A. J., Johnson, H. C., Sim, S. Y., Carter, A., Lambach, P., Hutubessy, R. C. W., Thompson, K. M., Badizadegan, K., Lambert, B., Ferrari, M. J., Jit, M., Fu, H., Silal, S. P., Hounsell, R. A., White, R. G., Mosser, J. F., Gaythorpe, K. A. M., Trotter, C. L., Lindstrand, A., … Bar-Zeev, N. (2024). Contribution of vaccination to improved survival and health: Modelling 50 years of the Expanded Programme on Immunization. The Lancet, 403(10441), 2307–2316. https://doi.org/10.1016/S0140-6736(24)00850-X
Cite this work
Our articles and data visualizations rely on work from many different people and organizations. When citing this topic page, please also cite the underlying data sources. This topic page can be cited as:
Fiona Spooner, Saloni Dattani, Samantha Vanderslott, and Max Roser (2022) - “Vaccination” Published online at OurWorldinData.org. Retrieved from: 'https://ourworldindata.org/vaccination' [Online Resource]BibTeX citation
@article{owid-vaccination,
    author = {Fiona Spooner and Saloni Dattani and Samantha Vanderslott and Max Roser},
    title = {Vaccination},
    journal = {Our World in Data},
    year = {2022},
    note = {https://ourworldindata.org/vaccination}
}
Reuse this work freely
All visualizations, data, and articles produced by Our World in Data are completely open access under the Creative Commons BY license. You have the permission to use, distribute, and reproduce these in any medium, provided the source and authors are credited.
The data produced by third parties and made available by Our World in Data is subject to the license terms from the original third-party authors. We will always indicate the original source of the data in our documentation, so you should always check the license of any such third-party data before use and redistribution.
All of our charts can be embedded in any site.