Definitions of world regions
Which countries make up the world regions commonly used in our charts?
Many of our charts show data grouped by world regions — like Africa, Asia, or Europe. But different sources define these regions in different ways. For clarity, this page shows how we define regional groupings on our site, and how those definitions compare to others you might come across, such as those from the World Bank, WHO, or the UN.
Below, you’ll find maps and downloadable CSVs listing which countries belong to each region under each classification.
If you’re looking at a chart on Our World in Data and see a region labeled simply as “Asia” or “Europe”, that means it’s using our definitions. If you see a source noted in brackets (e.g., “East Asia and Pacific (WB)”), it’s using that source’s regional scheme.
How to download country-to-region mappings
For each map, you can download the country-to-region mapping as a CSV: Click “Download” → “Data” → “Download full data”.
Our World in Data
Our team defines six world regions: Africa, Asia, Europe, North America, Oceania, and South America. This map shows how they are defined.
When using charts on our website, if you see these regions listed simply with these names, and without any institution acronym in brackets, these are the groupings applied.

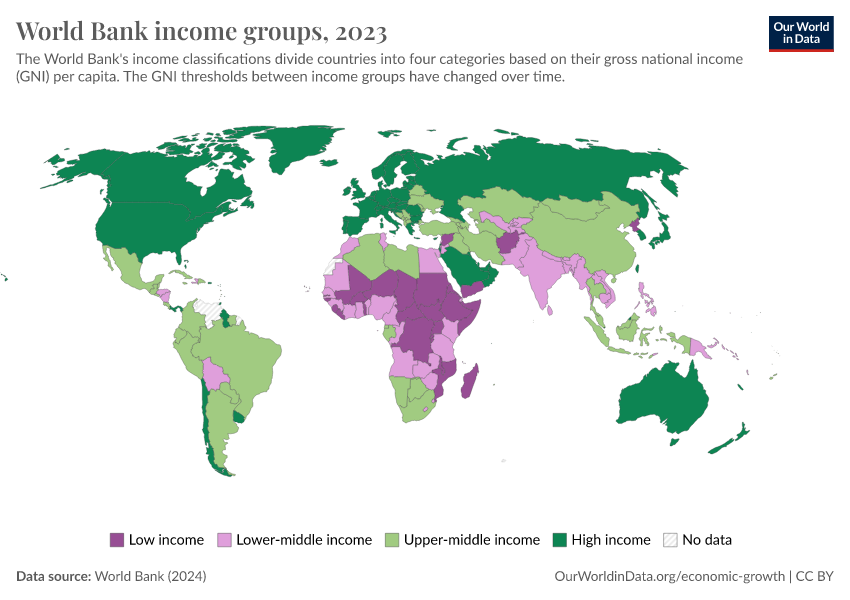
World Bank (WB), income groups
The World Bank defines four income groups: High income countries, Upper-middle income countries, Lower-middle income countries and Low income countries. This map shows how they are defined.
When using charts on our website, if you see these regions listed simply with these names, and without any institution acronym in brackets, these are the groupings applied.
We have an article detailing how the World Bank defines these regions and how we use them at Our World in Data.
Source: worldbank.org

World Bank (WB), continents
The World Bank defines seven world regions: East Asia and Pacific; Europe and Central Asia; Latin America and Caribbean; Middle East, North Africa, Afghanistan and Pakistan; North America; South Asia; and Sub-Saharan Africa. This map shows how they are defined.
When used in charts on our website, these regions will be listed as “[region] (WB)”, for example, “East Asia and Pacific (WB)”.
Source: worldbank.org

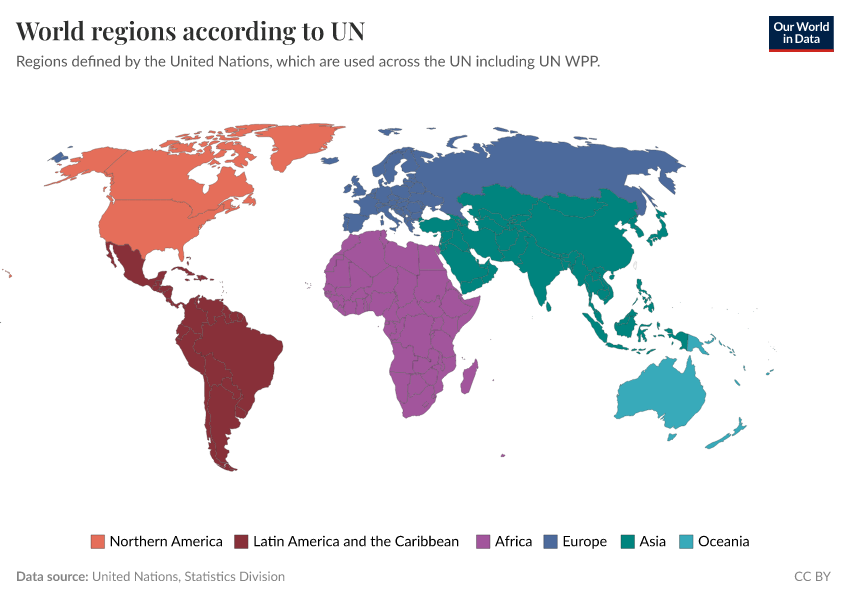
United Nations (UN)
The United Nations Statistical Division (UNSD) establishes and maintains a geoscheme based on the M49 coding classification. While not uniformly adopted by all autonomous United Nations agencies, this standard is frequently referenced.
At the highest level, the M49 classification categorizes countries into five principal regions: the Americas, Africa, Europe, Asia, and Oceania. The standard further provides more granular categories (e.g., Northern America, Sub-Saharan Africa, etc.).
A notable United Nations dataset, the World Population Prospects, employs a hybrid system derived from the M49 classifications, which is presented herein.
The authors state that "The assignment of countries or areas to specific groupings is for statistical convenience and does not imply any assumption regarding political or other affiliation of countries or territories by the United Nations."
When utilized in charts on our website, these regions will be denoted as “[region] (UN)”; for instance, “Oceania (UN)”.
Source: un.org

World Health Organization (WHO)
The World Health Organization defines six world regions: Africa, Americas, Eastern Mediterranean, Europe, South-East Asia, and Western Pacific. This map shows how they are defined.
When used in charts on our website, these regions will be listed as “[region] (WHO)”, for example, “Africa (WHO)”.
Source: who.int

United Nations Sustainable Development Goals (UN SDG)
When reporting data on the Sustainable Development Goals, the United Nations defines eight world regions: Australia and New Zealand, Central and Southern Asia, Eastern and South-Eastern Asia, Europe and Northern America, Latin America and the Caribbean, Northern Africa and Western Asia, Oceania, and Sub-Saharan Africa. This map shows how they are defined.
When used in charts on our website, these regions will be listed as “[region] (UN SDG)”, for example, “Central and Southern Asia (UN SDG)”.
Source: un.org

Maddison Project Database (Maddison)
The Maddison Project Database defines eight world regions: East Asia, Eastern Europe, Latin America, Middle East and North Africa, South and South East Asia, Sub-Saharan Africa, Western Europe, and Western offshoots. This map shows how they are defined.
When used in charts on our website, these regions will be listed as “[region] (Maddison)”, for example, “East Asia (Maddison)”.
Source: rug.nl

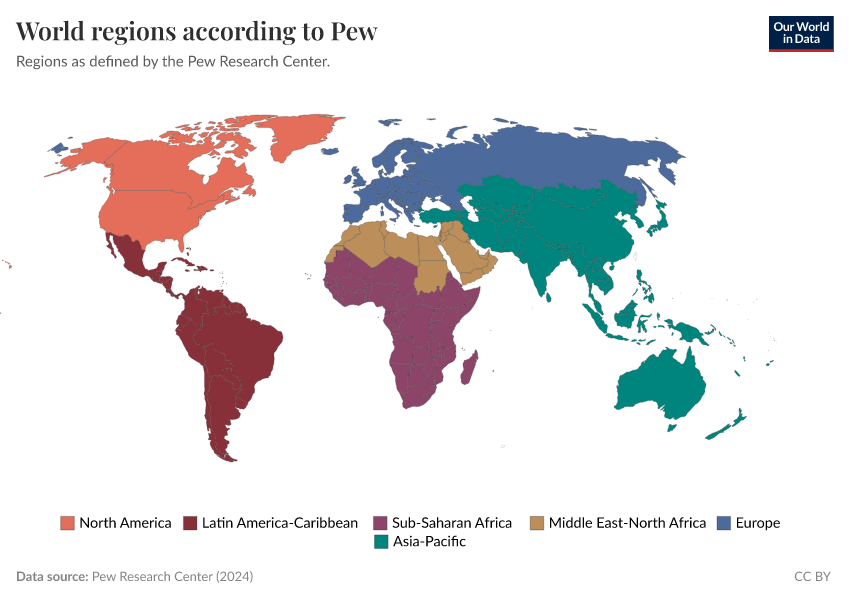
Pew Research Center (Pew)
The Pew Research Center defines six world regions: North America, Latin America-Caribbean, Sub-Saharan Africa, Middle East-North Africa, Europa, Asia-Pacific. This map shows how they are defined.
When used in charts on our website, these regions will be listed as “[region] (Pew)”, for example, “Asia-Pacific (Pew)”.
Source: pewresearch.org

Reuse this work freely
All visualizations, data, and code produced by Our World in Data are completely open access under the Creative Commons BY license. You have the permission to use, distribute, and reproduce these in any medium, provided the source and authors are credited.
The data produced by third parties and made available by Our World in Data is subject to the license terms from the original third-party authors. We will always indicate the original source of the data in our documentation, so you should always check the license of any such third-party data before use and redistribution.
All of our charts can be embedded in any site.